Design Objective
Design a portfolio that generates at least 10% annual cash distributions while maintaining long-term cumulative returns that remain competitive with the S&P 500.
Design a portfolio that generates at least 10% annual cash distributions while maintaining long-term cumulative returns that remain competitive with the S&P 500.
Most investors are told to avoid high-dividend ETFs because they destroy NAV, underperform broad-market index funds, and sacrifice long-term wealth for current income. For many early income ETFs, that conclusion was justified.
The ETF industry has evolved. Mechanical, fully covered option strategies have increasingly been replaced by more dynamic option-overlay approaches that preserve substantially more upside participation while continuing to generate meaningful cash distributions.
Yield without competitive cumulative return is not wealth creation.
Design for Wealth™ applies engineering design principles to identify high-income ETFs that merit serious consideration for specific investor use cases. Its three-model analysis evaluates actual observed performance, long-term strategy reconstruction, and plausible future conditions before the evidence is translated into portfolio architecture. The framework emphasizes cumulative return, opportunity cost, benchmark-relative performance, issuer quality, and disciplined allocation rather than yield alone.
Portfolio construction begins by defining design objectives before selecting solutions. Rather than selecting ETFs based on yield or recent performance, the framework applies consistent engineering principles to evaluate, allocate, and periodically improve the portfolio as new evidence becomes available.
| No. | Design Principle | Requirement & Application |
|---|---|---|
| 01 |
Design for Supplemental Capital |
Framework Scope
Design for Wealth™ is intended primarily for supplemental capital, not as a replacement for diversified long-term savings. High-distribution ETFs involve greater complexity and risk than broad-market index funds, so the framework is best suited to investors with an established savings foundation or a specific need for current income. |
| 02 |
Design for Sustainable Wealth |
Primary Optimization Objective
Long-term cumulative return is the primary optimization target. Income is valuable only when achieved while minimizing opportunity cost, avoiding structural NAV erosion, and remaining competitive with broad-market alternatives. |
| 03 |
Distinguish Sustainable from Destructive ROC |
Distribution Sustainability Standard
Return of capital (ROC) can have two very different meanings. Some ETFs classify part or all of a distribution as ROC for tax purposes even when portfolio income is sufficient to support the payment, potentially deferring taxes by reducing the investor's cost basis. Other high-distribution ETFs pay more than their strategy sustainably earns and effectively return invested capital, often accompanied by long-term NAV erosion. Design for Wealth™ evaluates ROC using distribution coverage, NAV trajectory, and cumulative total return. Destructive ROC fails the Design for Sustainable Wealth principle regardless of headline yield. |
| 04 |
Design for Reliable Monthly Income |
Cash-Flow Requirement
The portfolio targets recurring cash distributions of at least 10% annually. During accumulation, distributions are reinvested through DRIP. During an income phase, they may instead provide recurring cash flow without requiring routine asset sales. |
| 05 |
Design for Efficient Option Income |
Option-Structure Standard
Option-income strategies are not economically equivalent. The framework favors structures that preserve more of the underlying equity upside, while traditional covered-call strategies face a higher hurdle because their income is generated by surrendering part of that upside. Put-spread, partial-call, and other dynamic overlays are evaluated on their actual total-return trade-offs rather than strategy labels. |
| 06 |
Require Objective Evidence |
Validation Standard
Investment decisions are supported by three complementary models: actual observed performance, 15-year historical strategy reconstruction, and forward-looking scenarios with Monte Carlo analysis. Marketing claims, headline yield, and any single forecast are not sufficient evidence. Model results are then considered with issuer quality and portfolio fit. |
| 07 |
Diversify Independent Sources of Return |
Portfolio Architecture
Diversification extends beyond individual holdings. The portfolio combines complementary market exposures, issuers, investment methodologies, and option strategies to reduce dependence on any single source of return. |
| 08 |
Allocate Capital by Evidence |
Position-Sizing Standard
Position size reflects the strength of supporting evidence rather than equal weighting. New or less-proven strategies begin with smaller allocations and may earn larger positions as performance, execution, liquidity, and operating history strengthen the case. |
| 09 |
Continuously Improve the Design |
Engineering Review Cycle
Portfolio design is iterative. Holdings are reconsidered when meaningful new evidence changes expected outcomes, not as a reaction to ordinary short-term market volatility. |
Prefer diversified index-based or multi-company strategies over concentrated single-stock exposure.
Evaluate distribution sustainability using total return, NAV behavior, and distribution coverage rather than headline yield alone.
Validate strategies through all three models rather than relying on any single historical period, proxy, or forecast.
Introduce experimental strategies with limited allocations until sufficient evidence supports expansion.
Prefer managers who prioritize long-term capital appreciation alongside income generation.
Combine complementary income methodologies rather than relying on a single option strategy.
Consider tax efficiency when economically justified without confusing tax classification with economic sustainability.
Design portfolios to remain mathematically and psychologically durable during severe market declines.
A portfolio should not be judged by its current yield. It should be judged by its ability to generate sustainable income with the lowest practical opportunity cost.
Design for Wealth™ uses a structured process to identify high-income ETFs that can support the Design Objective. ETFs are screened, their strategies are understood, and their performance is evaluated through three complementary models. The resulting evidence informs qualification, classification, portfolio role, and allocation, but rank alone does not determine any of those decisions.
| No. | Methodology Stage | Process & Evaluation Standard | Primary Output |
|---|---|---|---|
| 01 | Identify ETFs for Evaluation | Screen diversified high-income ETFs capable of producing meaningful recurring distributions. Single-stock, cryptocurrency, and narrowly concentrated strategies are generally excluded from consideration as structural Core Holdings. | Defined set of high-income ETFs and passive benchmarks for analysis. |
| 02 | Understand the Strategy | Separate each ETF into its underlying investment exposure and income-generation methodology. Evaluate security selection, option structure, coverage, manager discretion, distribution objective, and commitment to capital appreciation. | Standardized strategy profile for meaningful comparison across funds. |
| 03 | Validate Through Three Models | Evaluate each ETF through three complementary analytical perspectives: Model 1: Actual observed cumulative return and opportunity-cost analysis. Model 2: 15-year historical strategy reconstruction and relative performance rank. Model 3: Forward-looking 15-year structural scenarios and Monte Carlo analysis. | Three-model evidence profile combining actual results, reconstructed historical behavior, and performance across plausible future conditions. |
| 04 | Evaluate Issuer and Execution Quality | Assess the people and organizations responsible for executing each strategy. Consider relevant experience, professional credentials, transparency, operational capability, liquidity, assets under management, sponsor commitment, and demonstrated execution. | Issuer and management confidence assessment. |
| 05 | Classify and Assign a Portfolio Role | Classify each qualifying ETF as Core, Diversification, or Experimental based on the strength and purpose of the supporting evidence. Then define the market exposure, income methodology, diversification benefit, and risk function it contributes. | Portfolio classification and defined functional role. |
| 06 | Allocate Capital by Evidence | Position size reflects the strength of the supporting evidence rather than equal weighting. Core status does not imply equal conviction or equal position size. New or less-proven strategies begin smaller and may earn larger allocations as performance, execution, liquidity, and operating history strengthen the case. | Evidence-weighted portfolio allocation. |
| 07 | Review and Improve the Design | Compare actual outcomes with expectations. Review cumulative return, opportunity cost, benchmark-relative performance, NAV behavior, distributions, manager execution, strategy changes, AUM, and market-stress behavior. Revise the design only when meaningful new evidence supports a change. | Documented continuous-improvement cycle. |
Core status requires strong evidence from all three models and cannot be earned by ranking alone. A Core Holding must also demonstrate competitive long-term total-return potential relative to appropriate alternatives, acceptable NAV behavior, a sound and repeatable methodology, credible execution, and a clear portfolio role. No model may reveal a material unresolved weakness.
Actual cumulative total return with distributions reinvested, including the return advantage or opportunity cost produced by owning each ETF instead of VOO and its designated passive benchmark. Full-period results cover February 1, 2024 through August 3, 2026.
pp = percentage points. Positive comparison values indicate a return advantage; negative values quantify the opportunity cost.
Full analytical tables shown below. Desktop viewing is recommended for detailed review.
All funds were measured over the same February 1, 2024 through August 3, 2026 period using directly observed total-return data. Evidence Confidence is High for every comparison in this section.
| Ticker | ETF Name | Cumulative Total Return |
Published Distribution Rate |
Opportunity-Cost Comparison vs. VOO (pp) |
Designated Benchmark |
Benchmark Type | Benchmark Cumulative Return |
Opportunity-Cost Comparison vs. Designated Benchmark (pp) |
AUM | Evidence Confidence |
|---|---|---|---|---|---|---|---|---|---|---|
| VOOG | Vanguard S&P 500 Growth ETF | 78.59% | 0.43% | +18.79 pp | N/A | N/A | N/A | N/A | $26.3 billion | High |
| OVL | Overlay Shares Large Cap Equity ETF | 65.03% | 10.46% | +5.23 pp | VOO | Broad S&P 500 opportunity-cost benchmark | 59.80% | +5.23 pp | $347.1 million | High |
| VUG | Vanguard Morningstar Growth ETF | 63.80% | 0.36% | +4.00 pp | N/A | N/A | N/A | N/A | $223.2 billion | High |
| SCHG | Schwab U.S. Large-Cap Growth ETF | 62.99% | 0.39% | +3.19 pp | N/A | N/A | N/A | N/A | $59.8 billion | High |
| GPIQ | Goldman Sachs Nasdaq-100 Premium Income ETF | 62.09% | 10.50% | +2.29 pp | QQQ | Nasdaq-100 growth benchmark | 68.17% | −6.08 pp | $5.0 billion | High |
| OVF | Overlay Shares Foreign Equity ETF | 60.99% | 10.38% | +1.19 pp | VXUS | International-equity benchmark | 58.86% | +2.13 pp | $49.2 million | High |
| VOO | Vanguard S&P 500 ETF | 59.80% | 1.00% | 0.00 pp | N/A | N/A | N/A | N/A | $979.0 billion | High |
| SCHK | Schwab 1000 Index ETF | 59.21% | 1.03% | −0.59 pp | N/A | N/A | N/A | N/A | $5.7 billion | High |
| VXUS | Vanguard Total International Stock ETF | 58.86% | 2.52% | −0.94 pp | N/A | N/A | N/A | N/A | $156.5 billion | High |
| VTI | Vanguard Morningstar Total Stock Market ETF | 58.70% | 1.03% | −1.10 pp | N/A | N/A | N/A | N/A | $660.7 billion | High |
| QQQI | NEOS Nasdaq-100 High Income ETF | 55.17% | 14.01% | −4.63 pp | QQQ | Nasdaq-100 growth benchmark | 68.17% | −13.00 pp | $13.2 billion | High |
| OVS | Overlay Shares Small Cap Equity ETF | 50.86% | 10.52% | −8.94 pp | IJR | S&P SmallCap 600 small-cap benchmark | 46.37% | +4.49 pp | $35.2 million | High |
| JEPQ | JPMorgan Nasdaq Equity Premium Income ETF | 48.92% | 10.45% | −10.88 pp | QQQ | Nasdaq-100 growth benchmark | 68.17% | −19.25 pp | $40.3 billion | High |
| SPYI | NEOS S&P 500 High Income ETF | 47.67% | 12.04% | −12.13 pp | VOO | Broad S&P 500 opportunity-cost benchmark | 59.80% | −12.13 pp | $10.9 billion | High |
| DIA | State Street SPDR Dow Jones Industrial Average ETF Trust | 43.51% | 1.34% | −16.29 pp | N/A | N/A | N/A | N/A | $45.2 billion | High |
| JEPI | JPMorgan Equity Premium Income ETF | 24.26% | 8.40% | −35.54 pp | VOO | Broad S&P 500 opportunity-cost benchmark | 59.80% | −35.54 pp | $45.0 billion | High |
Each result begins at the fund's calculation start and ends August 3, 2026. Because operating histories differ, cumulative returns should not be compared directly across rows. The opportunity-cost comparison uses each fund's designated benchmark over the same fund-specific period.
| Ticker | ETF Name | Cumulative Total Return |
Published Distribution Rate |
Designated Benchmark |
Benchmark Type | Benchmark Cumulative Return |
Opportunity-Cost Comparison vs. Designated Benchmark (pp) |
AUM | Calculation Start |
Observation Years |
Evidence Confidence |
|---|---|---|---|---|---|---|---|---|---|---|---|
| KQQQ | Kurv Technology Titans Select ETF | 46.84% | 14.50% | QQQ | Nasdaq-100 growth benchmark | 46.67% | +0.17 pp | $127.8 million | 07/23/2024 | 2.03 | High |
| QDVO | Amplify CWP Growth & Income ETF | 44.84% | 10.97% | SCHG | Large-cap growth benchmark | 39.12% | +5.72 pp | $726.2 million | 08/22/2024 | 1.95 | High |
| OMAH | VistaShares Target 15 Berkshire Select Income ETF | 18.30% | 15.00% | BRK-B | Approximate Berkshire-oriented proxy | −2.95% | +21.25 pp | $992.8 million | 03/20/2025 | 1.37 | Moderate |
| CHPY | YieldMax Semiconductor Portfolio Option Income ETF | 130.74% | 40.72% | SMH | Semiconductor-sector benchmark | 154.78% | −24.04 pp | $1.1 billion | 04/02/2025 | 1.34 | Moderate |
| QUSA | VistaShares Target 15 USA Quality Income ETF | 5.76% | 15.00% | QUAL | U.S. quality-factor benchmark | 25.35% | −19.59 pp | $21.5 million | 05/20/2025 | 1.20 | Moderate |
| TDAQ | TappAlpha Innovation 100 Growth & Daily Income ETF | 22.96% | 17.10% | QQQ | Nasdaq-100 growth benchmark | 22.29% | +0.67 pp | $267.3 million | 09/04/2025 | 0.91 | Low |
| ODTE | VegaShares SPX NDX RTY Premium Income ETF | 8.34% | 15.00% | Approx. 1/3 VOO + 1/3 QQQ + 1/3 VTWO | Constructed S&P 500, Nasdaq-100, and Russell 2000 benchmark | 17.95% | −9.61 pp | $3.1 million | 04/02/2026 | 0.34 | Low |
| DRMY | XFUNDS Memory Income ETF | −3.08% | 34.5% | SOXX | Broad semiconductor proxy; a memory-specific benchmark is preferred for future review | −4.30% | +1.22 pp | $2.2 million | 07/16/2026 | 0.05 | Low |
Strategy-proxy model comparing how each fund's underlying market exposure and investment or income methodology might have behaved over the 15-year period ending June 30, 2026. Central assumptions are informed by long-history references, live-period evidence, strategy evidence, and fund expenses. The period included exceptional U.S. large-cap growth and technology performance, so these rankings describe that historical environment rather than expected future leadership.
Full analytical model shown below. Desktop viewing is recommended for detailed review.
| Ticker | ETF Name | 15-Year Cumulative Return Rank |
Modeled Net CAGR |
Estimated Net Strategy Effect |
Key Analytical Rationale |
Historical Exposure Reference |
Underlying Historical CAGR Assumption |
Investment & Income/Option Methodology |
Published Distribution Rate |
Expense Ratio |
Evidence Confidence |
|---|---|---|---|---|---|---|---|---|---|---|---|
| KQQQ | Kurv Technology Titans Select ETF | 1 | 17.51% | −1.0% | Live NAV trailed NDX by only ~0.95 pp; after adding back the 0.99% expense ratio, the observed gross residual is near zero. The −1.0% modeled strategy effect applies a conservative allowance relative to the live evidence. | QQQ / Nasdaq-100 reference for concentrated tech | 19.5% | Concentrated portfolio of large technology/innovation companies with selective option writing on portfolio holdings to generate income while retaining substantial equity participation. | 14.50% | 0.99% | Low |
| GPIQ | Goldman Sachs Nasdaq-100 Premium Income ETF | 2 | 17.21% | −2.0% | Nasdaq-100 evidence raises the historical equity assumption materially; partial/dynamic calls justify a smaller drag than fuller overwrite strategies. | QQQ / Nasdaq-100 | 19.5% | Nasdaq-100-oriented equity exposure with a dynamically managed partial call-writing overlay intended to generate premium income while preserving meaningful upside participation. | 10.50% | 0.29% | Moderate |
| VOOG | Vanguard S&P 500 Growth ETF | 3 | 16.93% | 0.0% | Near-full 15-year issuer history makes the central growth assumption comparatively well anchored. | Direct fund history | 17.0% | Passive exposure to the S&P 500 Growth Index; no option overlay. | 0.43% | 0.07% | High |
| SCHG | Schwab U.S. Large-Cap Growth ETF | 4 | 16.66% | 0.0% | Passive exact-style proxy; central reflects observed SCHG growth history with proxy-fee normalization and rounding. | Direct fund history | 16.7% | Passive exposure to the Dow Jones U.S. Large-Cap Growth Total Stock Market Index; no option overlay. | 0.39% | 0.04% | High |
| JEPQ | JPMorgan Nasdaq Equity Premium Income ETF | 5 | 16.15% | −3.0% | Nasdaq-100 reference is strong, but active stock selection plus ELN calls contaminate residuals; retain a material call drag with moderate confidence. | QQQ / Nasdaq-100 reference | 19.5% | Actively selected Nasdaq-oriented large-cap growth equities combined with equity-linked notes that embed one-month out-of-the-money call exposure. | 10.45% | 0.35% | Moderate |
| VUG | Vanguard Morningstar Growth ETF | 6 | 15.47% | 0.0% | Passive exact fund proxy; benchmark changed historically, so range allows modest reconstruction uncertainty. | Direct fund history | 15.5% | Passive exposure to the Morningstar US Large-Mid Cap Broad Growth Index; no option overlay. | 0.36% | 0.03% | High |
| QDVO | Amplify CWP Growth & Income ETF | 7 | 15.44% | −1.0% | VOOG is a defensible growth proxy, but active stock selection and tactical partial calls make the strategy effect uncertain. | VOOG / S&P 500 Growth proxy for active growth book | 17.0% | Actively selected large-cap growth equities with tactical covered calls written on only a portion of selected holdings, seeking income while retaining substantial upside participation. | 10.97% | 0.56% | Low |
| OVL | Overlay Shares Large Cap Equity ETF | 8 | 15.21% | +1.2% | Direct 6.75-year live evidence shows +0.85 pp net residual vs S&P; adding back fund expense supports a positive gross overlay effect. Central +1.2% is below the live +1.64% gross residual. | VOO / S&P 500 equity beta | 14.8% | Broad U.S. large-cap equity exposure combined with an actively managed S&P 500/SPX put-spread overlay designed to monetize option premium while preserving equity upside. | 10.46% | 0.79% | Moderate |
| QQQI | NEOS Nasdaq-100 High Income ETF | 9 | 14.82% | −4.0% | Nasdaq-100 exposure is clear; high-income NDX call writing should create meaningful upside drag in the 2011–2026 bull regime. Short live history limits precision. | QQQ / Nasdaq-100 | 19.5% | Nasdaq-100 equity exposure combined with a tax-aware NDX call strategy that sells calls and may purchase calls to manage upside participation and income. | 14.01% | 0.68% | Low |
| VOO | Vanguard S&P 500 ETF | 10 | 14.77% | 0.0% | Direct passive S&P 500 proxy with very low fee; one of the strongest historical inputs. | Direct fund history | 14.8% | Passive exposure to the S&P 500 Index; no option overlay. | 1.00% | 0.03% | High |
| SCHK | Schwab 1000 Index ETF | 11 | 14.67% | 0.0% | IWB/Russell 1000 is a close long-history proxy, but not the exact Schwab 1000 methodology. | IWB / Russell 1000 proxy for Schwab 1000 | 14.7% | Passive exposure to the Schwab 1000 Index, representing approximately the largest 1,000 U.S. companies; no option overlay. | 1.03% | 0.03% | Moderate |
| VTI | Vanguard Morningstar Total Stock Market ETF | 12 | 14.47% | 0.0% | Direct total-market proxy; approximate 15-year evidence supports a central slightly below S&P 500. | Direct fund history | 14.5% | Passive exposure to the Morningstar US Total Market Index; no option overlay. | 1.03% | 0.03% | High |
| TDAQ | TappAlpha Innovation 100 Growth & Daily Income ETF | 13 | 13.67% | −5.0% | Nasdaq-100 proxy is strong, but daily/0DTE-style call resetting lacks a defensible long-history analogue. Central assumes substantial bull-market upside truncation. | QQQ / Nasdaq-100 | 19.5% | Nasdaq-100/innovation-oriented equity exposure combined with daily short-duration call writing intended to generate recurring option income. | 17.10% | 0.83% | Low |
| DIA | State Street SPDR Dow Jones Industrial Average ETF Trust | 14 | 12.54% | 0.0% | Direct passive DJIA proxy; central reflects the available long-history range and current fee. | Direct fund history | 12.7% | Passive price-weighted exposure to the 30-stock Dow Jones Industrial Average; no option overlay. | 1.34% | 0.16% | High |
| DRMY | XFUNDS Memory Income ETF | 15 | 12.49% | −4.5% | Broad semiconductor proxy is only an approximation for memory stocks and the multi-leg option structure has essentially no representative live history. Wide range required. | SOXX / broad semiconductor proxy | 18.0% | Actively selected memory-semiconductor equities combined with sold and purchased options/spreads intended to generate income alongside capital appreciation. | 34.5% | 1.01% | Low |
| QUSA | VistaShares Target 15 USA Quality Income ETF | 16 | 11.95% | −2.0% | Quality proxy is reasonable but not exact; Target 15 covered-call overlay is very young, so strategy drag is judgment-based with a wide range. | QUAL / U.S. quality factor (S&P 500 cross-check) | 14.9% | Rules-based U.S. quality equity selection combined with out-of-the-money covered calls under a Target 15 income framework. | 15.00% | 0.95% | Low |
| SPYI | NEOS S&P 500 High Income ETF | 17 | 11.42% | −2.7% | Live fund materially lagged S&P in the bull period; adding back expense implies a strategy drag around the high-2% range. BXM provides directional confirmation but is structurally more aggressive. | VOO / S&P 500 | 14.8% | S&P 500 equity exposure combined with a tax-aware SPX call strategy that sells calls and may purchase calls to retain part of the market's upside. | 12.04% | 0.68% | Moderate |
| OVS | Overlay Shares Small Cap Equity ETF | 18 | 11.17% | +1.0% | Equity beta is S&P SmallCap 600 while puts are SPX-family. Same put-spread concept as OVL supports a positive central overlay effect, discounted for cross-index basis risk. | IJR / S&P SmallCap 600 equity beta; SPX option overlay | 11.0% | S&P SmallCap 600/IJR-type small-cap equity exposure combined with a separate S&P 500/SPX put-spread overlay; the equity and option reference markets are different. | 10.52% | 0.83% | Moderate |
| CHPY | YieldMax Semiconductor Portfolio Option Income ETF | 19 | 10.97% | −6.0% | Semiconductor proxy is broad and option program is aggressive; high distribution is not treated as return, but structure supports a large uncertain drag. | SOXX / broad semiconductor proxy | 18.0% | Actively selected semiconductor equities combined with an aggressive option-income program on portfolio holdings. | 40.72% | 1.03% | Low |
| ODTE | VegaShares SPX NDX RTY Premium Income ETF | 20 | 10.74% | −3.5% | Equity exposure is approximated using S&P 500, Nasdaq-100 and Russell 2000 (VTWO) references. 0DTE calls lack long-history analogues, so the strategy effect remains low-confidence. | ~1/3 VOO + ~1/3 QQQ + ~1/3 VTWO (Russell 2000) | 15.0% | Approximately one-third S&P 500, Nasdaq-100 and Russell 2000 equity exposure with short-dated SPX, NDX and RUT call writing and frequent resets. | 15.00% | 0.76% | Low |
| OMAH | VistaShares Target 15 Berkshire Select Income ETF | 21 | 10.55% | −2.0% | BRK.B-centered proxy captures the architecture imperfectly; Target 15 option overlay is too young for validation, so central drag remains modest but uncertain. | BRK.B-centered proxy for Berkshire-select equity book | 13.5% | Berkshire Hathaway-centered equity architecture combined with a Target 15 option-income overlay on the Berkshire-select portfolio. | 15.00% | 0.95% | Low |
| JEPI | JPMorgan Equity Premium Income ETF | 22 | 10.45% | −4.0% | Using S&P 500 as the reference requires the strategy-effect term to absorb both lower-vol active equity selection and ELN call overwrite. Longer live history helps, but decomposition remains uncertain. | VOO / S&P 500 reference; active lower-vol equity differs | 14.8% | Actively selected lower-volatility U.S. large-cap equities combined with ELNs that embed one-month out-of-the-money S&P 500 call exposure. | 8.40% | 0.35% | Moderate |
| OVF | Overlay Shares Foreign Equity ETF | 23 | 8.17% | +1.0% | VEA is used as the developed-market proxy; issuer methodology identifies SPX/SPXW put spreads despite the fund’s foreign equity beta. The positive overlay effect is informed by OVL/OVS evidence, with an allowance for cross-index uncertainty. | VEA / developed ex-U.S.; minority emerging markets; SPX option overlay | 8.0% | Developed ex-U.S. equity exposure, with minority emerging-markets exposure, combined with an S&P 500/SPX-SPXW put-spread overlay. | 10.38% | 0.83% | Moderate |
| VXUS | Vanguard Total International Stock ETF | 24 | 6.65% | 0.0% | Direct passive ex-U.S. history from inception is close to the full 15-year window; strongest international control case. | Direct fund history | 6.7% | Passive broad developed- and emerging-market equity exposure outside the United States; no option overlay. | 2.52% | 0.05% | High |
Forward-looking comparison of 24 ETFs across three coherent economic regimes, supported by a 50,000-path joint Monte Carlo rank-stability analysis. Base Rank is the primary deterministic comparison; detailed Monte Carlo outputs are provided in the downloadable workbook, and published distribution rates reflect the August 2026 model snapshot.
Continued mega-cap strength combines with reshoring, strategic domestic investment, expanded power infrastructure, and growth among smaller U.S. suppliers.
Industrial and AI investment continues, but overcapacity, depreciation, elevated costs, or lower stock valuations reduce shareholder returns. In practical terms, international equities outperform the broad U.S. market, while defensive and value-oriented U.S. strategies outperform U.S. growth.
AI and industrial capital investment generate high utilization, productivity growth, successful reshoring, and stronger competitive advantages for leading U.S. companies.
These scenarios are coherent economic regimes used to test the sensitivity of relative ETF rankings; they are not claims that any specific future outcome is known. Monte Carlo also assigns a separate 15% chance to a future in which international stocks, starting from lower prices relative to earnings, outperform U.S. stocks. Detailed rank-stability results remain in the downloadable workbook.
Full analytical model shown below. Desktop viewing is recommended for detailed review.
| Ticker | ETF Name | Base 15-Year Rank |
Base Modeled Net CAGR |
Conservative 15-Year Rank |
Upside 15-Year Rank |
Estimated Net Strategy Effect — Base |
Key Analytical Rationale |
Forward Exposure / Index |
Base Underlying CAGR Assumption |
Investment & Income/Option Methodology |
Published Distribution Rate |
Expense Ratio |
Evidence Confidence |
|---|---|---|---|---|---|---|---|---|---|---|---|---|---|
| OVS | Overlay Shares Small Cap Equity ETF | 1 | 7.27% | 13 | 7 | +0.5% | Domestic small companies can participate as suppliers and service providers to reshoring, grid and industrial investment. The SPX put-spread overlay may add premium, but the small-cap equity/SPX option mismatch creates wide rank uncertainty. | S&P SmallCap 600 / IJR-type equity exposure | 7.6% | S&P SmallCap 600-oriented equity exposure combined with actively managed SPX-family put spreads. | 10.52% | 0.83% | Moderate |
| VUG | Vanguard Morningstar Growth ETF | 2 | 7.17% | 14 | 1 | 0.0% | Base assumptions allow U.S. large-growth leaders to keep compounding through AI investment, reshoring and productivity gains without extrapolating the exceptional prior 15-year return. The conservative regime explicitly tests valuation compression. | Morningstar US Large-Mid Cap Broad Growth Index | 7.2% | Passive exposure to the Morningstar US Large-Mid Cap Broad Growth Index; no option overlay. | 0.36% | 0.03% | High |
| SCHG | Schwab U.S. Large-Cap Growth ETF | 3 | 7.16% | 15 | 2 | 0.0% | Broad large-cap growth exposure is positioned to benefit from continued U.S. technology leadership and capital investment. Its lower expense ratio slightly improves modeled results relative to otherwise similar growth exposure. | Dow Jones U.S. Large-Cap Growth Total Stock Market Index | 7.2% | Passive exposure to the Dow Jones U.S. Large-Cap Growth Total Stock Market Index; no option overlay. | 0.39% | 0.04% | High |
| DIA | State Street SPDR Dow Jones Industrial Average ETF Trust | 4 | 7.14% | 2 | 11 | 0.0% | The Dow's value, industrial and quality characteristics are positioned to benefit from manufacturing, infrastructure and grid investment. Its concentrated price-weighted structure limits how fully it captures the broader opportunity. | Dow Jones Industrial Average | 7.3% | Passive price-weighted exposure to the 30-stock Dow Jones Industrial Average; no option overlay. | 1.34% | 0.16% | High |
| VOOG | Vanguard S&P 500 Growth ETF | 5 | 7.13% | 16 | 3 | 0.0% | S&P 500 growth exposure captures profitable mega-cap platforms and other growth leaders. The Base and Upside regimes reflect potential benefits from reindustrialization, AI investment, and productivity growth, while the Conservative regime tests substantial valuation compression. | S&P 500 Growth Index | 7.2% | Passive exposure to the S&P 500 Growth Index; no option overlay. | 0.43% | 0.07% | High |
| VTI | Vanguard Morningstar Total Stock Market ETF | 6 | 7.03% | 10 | 4 | 0.0% | Total-market exposure most directly combines mega-cap platforms with mid- and small-company beneficiaries of reshoring, power demand and domestic supply-chain investment. It is therefore a broad expression of the central U.S. expansion regime. | Morningstar US Total Market Index | 7.1% | Passive broad U.S. total-market exposure; no option overlay. | 1.03% | 0.03% | High |
| SCHK | Schwab 1000 Index ETF | 6 | 7.03% | 10 | 4 | 0.0% | Broad U.S. exposure combines large-company leadership with smaller domestic beneficiaries. Its modeled inputs and expense ratio are identical to VTI, producing an exact analytical tie. | Schwab 1000 Index | 7.1% | Passive exposure to the Schwab 1000 Index; no option overlay. | 1.03% | 0.03% | High |
| OVL | Overlay Shares Large Cap Equity ETF | 8 | 7.01% | 8 | 9 | +0.8% | S&P 500 exposure participates in U.S. large-cap leadership while the SPX put-spread overlay may harvest volatility premium. The Base regime applies a modest positive overlay effect, with a smaller assumed benefit in the strongest equity regime. | S&P 500 / VOO-type equity exposure | 7.0% | S&P 500-oriented equity exposure combined with actively managed SPX put spreads. | 10.46% | 0.79% | Moderate |
| VOO | Vanguard S&P 500 ETF | 9 | 6.97% | 9 | 6 | 0.0% | The S&P 500 captures the best-capitalized U.S. platforms and major industrial beneficiaries of domestic investment. The Base regime assumes continued participation in broad U.S. expansion, while the Conservative regime tests the effect of valuation compression. | S&P 500 Index | 7.0% | Passive exposure to the S&P 500 Index; no option overlay. | 1.00% | 0.03% | High |
| GPIQ | Goldman Sachs Nasdaq-100 Premium Income ETF | 10 | 6.31% | 21 | 8 | −1.0% | Nasdaq-oriented exposure benefits from the AI and capital-investment thesis. Recent partial call coverage supports more upside participation than a full overwrite, although the overlay still creates increasing drag in stronger markets. | Nasdaq-100-oriented equity exposure | 7.6% | Nasdaq-100-oriented equity exposure with a dynamically managed partial call overlay. | 10.50% | 0.29% | Moderate |
| QDVO | Amplify CWP Growth & Income ETF | 11 | 6.14% | 20 | 12 | −0.5% | Active growth selection and partial calls may preserve more upside than a full overwrite. The U.S. growth thesis improves the underlying outlook, but short history and inseparable stock-selection/option effects keep confidence low. | Actively selected large-cap growth equities | 7.2% | Actively selected large-cap growth equities combined with tactical, partial call writing on portfolio holdings. | 10.97% | 0.56% | Low |
| KQQQ | Kurv Technology Titans Select ETF | 12 | 6.11% | 22 | 10 | −0.5% | Concentrated technology exposure benefits from stronger U.S. growth assumptions, while selective calls impose more drag in sustained upside. Short history, concentration and active selection create a wide simulated rank range. | Concentrated technology/innovation portfolio | 7.6% | Concentrated active technology/innovation portfolio with selective option writing on holdings. | 14.50% | 0.99% | Low |
| VXUS | Vanguard Total International Stock ETF | 13 | 6.05% | 1 | 14 | 0.0% | International equities may benefit from lower starting valuations and favorable global investment conditions. The Monte Carlo analysis includes a separate regime in which international stocks catch up with and outperform U.S. stocks, while the Base regime assumes stronger relative support from U.S. reindustrialization and broad domestic expansion. | FTSE Global All Cap ex US Index | 6.1% | Passive developed- and emerging-market equity exposure outside the United States; no option overlay. | 2.52% | 0.05% | High |
| JEPQ | JPMorgan Nasdaq Equity Premium Income ETF | 14 | 5.75% | 18 | 13 | −1.5% | Active Nasdaq-oriented stock selection and ELN calls benefit from the U.S. technology thesis but cannot be cleanly decomposed. The strategy is expected to hold up better in weak markets and surrender more upside in strong ones. | Actively selected Nasdaq-oriented equities | 7.6% | Actively selected Nasdaq-oriented equities combined with ELNs embedding one-month out-of-the-money Nasdaq-100 calls. | 10.45% | 0.35% | Moderate |
| OVF | Overlay Shares Foreign Equity ETF | 15 | 5.67% | 4 | 16 | +0.4% | International equities retain a meaningful catch-up case, while SPX put spreads may add premium. Currency exposure and the foreign-equity/SPX option mismatch produce substantial basis risk and a wide Monte Carlo range. | Developed ex-U.S. with minority emerging-markets exposure | 6.1% | Developed and emerging ex-U.S. equity exposure combined with actively managed SPX/SPXW put spreads. | 10.38% | 0.83% | Moderate |
| JEPI | JPMorgan Equity Premium Income ETF | 16 | 5.65% | 5 | 18 | −1.0% | Lower-volatility quality/value selection and ELN calls are aligned with the conservative regime and can benefit from industrial broadening. The same defensive structure is expected to lag in the strongest growth-led outcome. | Actively selected lower-volatility U.S. large-cap equities | 7.0% | Actively selected lower-volatility U.S. large-cap equities combined with ELNs embedding S&P 500 call exposure. | 8.40% | 0.35% | Moderate |
| OMAH | VistaShares Target 15 Berkshire Select Income ETF | 17 | 5.50% | 3 | 22 | −0.8% | Berkshire-inspired quality and value holdings align with industrial, energy and infrastructure expansion. The young fund's equity selection and option overlay cannot be separated reliably, so its conservative strength comes with a very wide simulated range. | BRK.B plus Berkshire's largest disclosed holdings | 7.2% | Berkshire Hathaway and Berkshire-inspired holdings combined with a dynamically managed options portfolio targeting income. | 15.00% | 0.95% | Low |
| DRMY | XFUNDS Memory Income ETF | 18 | 5.49% | 24 | 15 | −2.0% | Domestic chip investment and AI demand increase memory-sector upside, while a near-flat conservative assumption reflects cyclicality and execution risk. Concentration and complex option spreads generate extreme favorable and unfavorable rank outcomes. | 8–15 memory-related semiconductor equities | 8.5% | Concentrated memory-semiconductor equity portfolio combined with synthetic covered calls and credit call/put spreads. | N/A | 1.01% | Low |
| QUSA | VistaShares Target 15 USA Quality Income ETF | 19 | 5.45% | 6 | 21 | −0.8% | Quality companies can benefit from domestic investment and strong balance sheets, while options provide income and downside support. The fund's short record and combined selection/option effect justify low confidence and wide uncertainty. | U.S. quality equity selection | 7.2% | Rules-based U.S. quality equity selection combined with out-of-the-money covered-call and option positions. | 15.00% | 0.95% | Low |
| CHPY | YieldMax Semiconductor Portfolio Option Income ETF | 20 | 5.27% | 23 | 19 | −2.5% | Semiconductor reshoring and AI infrastructure support stronger Base and Upside return assumptions for the sector. High concentration, cyclicality and aggressive call spreads produce an unusually wide distribution of possible ranks. | 15–30 semiconductor companies | 8.8% | Concentrated semiconductor equity portfolio combined with call spreads on portfolio holdings. | 40.72% | 1.03% | Low |
| QQQI | NEOS Nasdaq-100 High Income ETF | 21 | 4.92% | 19 | 17 | −2.0% | Nasdaq-100 exposure benefits from AI-led growth, but the high-income call-spread objective creates meaningful upside monetization. A broad strategy-effect range reflects execution and market-path uncertainty. | Nasdaq-100 Index | 7.6% | Nasdaq-100 equity exposure combined with tax-aware sold and purchased NDX call options. | 14.01% | 0.68% | Moderate |
| ODTE | VegaShares SPX NDX RTY Premium Income ETF | 22 | 4.64% | 12 | 24 | −2.0% | Its multi-index exposure spans large-cap, Nasdaq and small-cap beneficiaries, but short-dated calls repeatedly reset upside participation. High path dependence produces a materially weaker upside rank and wide strategy uncertainty. | Approximately equal S&P 500, Nasdaq-100 and Russell 2000 exposures | 7.4% | Approximately equal S&P 500, Nasdaq-100 and Russell 2000 exposure combined with short-dated SPX, NDX and RUT calls. | 15.00% | 0.76% | Low |
| SPYI | NEOS S&P 500 High Income ETF | 23 | 4.52% | 7 | 23 | −1.8% | S&P 500 exposure participates in domestic expansion, while sold and purchased SPX calls can improve weak-market resilience. The income objective creates increasing drag in a strong, persistent equity advance. | S&P 500 Index | 7.0% | S&P 500 equity exposure combined with tax-aware sold and purchased SPX calls. | 12.04% | 0.68% | Moderate |
| TDAQ | TappAlpha Innovation 100 Growth & Daily Income ETF | 24 | 4.27% | 17 | 20 | −2.5% | Nasdaq exposure participates in the AI-productivity regime, but daily short-duration calls can repeatedly cap rebounds and sustained upside. Limited live evidence and high path dependence keep the base rank low. | QQQM / Nasdaq-100-oriented exposure | 7.6% | QQQM/Nasdaq-100-oriented exposure combined with a daily short-duration call overlay. | N/A | 0.83% | Low |
Portfolio construction is separated into distinct decisions: determine which strategies qualify for inclusion, classify each holding according to the strength and purpose of its supporting evidence, and allocate capital within defined structural constraints.
A minimum of 80% of portfolio assets should be allocated to Core Holdings. Remaining capital may be assigned to Diversification Holdings and Experimental Holdings that satisfy defined diversification, validation, or asymmetric-return objectives.
The allocation requirement does not lower the Core qualification standard. If too few funds qualify, additional funds must be evaluated rather than promoting weaker holdings merely to satisfy the allocation target.
Core classification establishes eligibility for foundational use. It does not imply equal conviction or equal position size. Allocation within Core should reflect evidence strength, liquidity, concentration, operating history, and implementation risk.
Strategies that satisfy the Core qualification standard through strong evidence from all three models and also demonstrate competitive total-return potential, credible methodology and execution, adequate liquidity, and a clear portfolio role.
Strategies that do not satisfy every Core requirement but earn inclusion because they add meaningful, non-redundant market exposure, factor exposure, issuer or manager diversification, investment methodology, or return behavior.
Deliberately limited strategies included either to evaluate newer or less-validated methodologies or to capture unusually high asymmetric-return potential when the associated volatility, concentration, or execution risk warrants strict position limits.
Classification determines structural status; functional categories define what each holding must contribute to the portfolio.
| Functional Category | Design Objective | Current Allocation | Current ETFs | Selection Standard |
|---|---|---|---|---|
| Core Holdings · 85% of Portfolio | ||||
| Broad-Market Income Portfolio Foundation | Preserve diversified U.S. large-cap equity exposure while generating sustainable monthly income with a minimized opportunity cost in long-term cumulative return. | 57.0% | OVL | Must provide diversified broad-market holdings, strong long-term NAV behavior, competitive cumulative return, sustainable option-income generation, and high confidence in manager execution. |
| Technology Growth Income Innovation Exposure | Participate in long-term technology innovation and mega-cap earnings growth while converting a portion of expected return into recurring monthly income. | 14.0% | GPIQ | Must provide diversified Nasdaq-oriented growth exposure, credible upside participation, sustainable premium generation, and strong evidence that the option methodology does not impose an excessive opportunity cost. |
| Large-Cap Growth Income Growth Participation | Capture long-term earnings growth from high-quality large-cap companies while producing meaningful income and preserving substantial upside participation. | 7.0% | QDVO | Must emphasize diversified growth-oriented holdings and use a selective or partial option overlay that does not unnecessarily suppress long-term capital appreciation. |
| Small-Cap Income Market-Capitalization Diversification | Expand the portfolio beyond large-cap equities by combining long-term small-cap appreciation with income from a differentiated SPX put-spread overlay. | 7.0% | OVS | Must provide broad small-cap exposure, a defensible SPX option-income methodology, competitive total-return potential, and meaningful diversification from large-cap and Nasdaq-focused holdings. The mismatch between small-cap equities and SPX options must remain acceptable. |
| Diversification Holdings · 11.5% of Portfolio | ||||
| Quality & Intrinsic-Value Income Factor Diversification | Add exposure to profitable, financially resilient companies and Berkshire-style intrinsic-value investing that may perform differently from technology-led growth portfolios. | 6.0% | OMAH · QUSA | Must emphasize strong balance sheets, durable earnings, quality or value characteristics, and an income overlay designed to retain meaningful participation in the underlying holdings. |
| Complementary Broad-Market Income Manager and Methodology Diversification | Add a second broad U.S. large-cap income implementation with an independently managed equity and option process, reducing dependence on a single broad-market premium-generation methodology. | 3.0% | SPUC | Must preserve broad-market participation, generate meaningful recurring income, and demonstrate acceptable upside capture, NAV behavior, and execution under the current strategy before consideration for Core. |
| Additional Technology Diversification Manager and Methodology Diversification | Supplement the primary technology allocation with a complementary manager and option structure rather than concentrating all Nasdaq exposure in one fund or premium-generation technique. | 1.0% | KQQQ | Must provide a differentiated technology implementation, credible income generation, and a portfolio role that complements rather than merely duplicates the primary Technology Growth Income allocation. |
| International Income Geographic Diversification | Reduce exclusive dependence on U.S. equity valuations and economic conditions through a limited allocation to broad international equities, primarily developed markets with a smaller emerging-markets component. | 1.5% | OVF | Must provide diversified international exposure, a defensible SPX-family option overlay, competitive long-term total-return potential, and acceptable cross-index risk between foreign equities and U.S. index options. |
| Experimental Holdings · 3.5% of Portfolio | ||||
| Broad-Index Income Innovation Methodology Validation | Evaluate a specialized short-duration option methodology designed to increase cash generation while retaining diversified exposure to multiple broad U.S. equity indexes. | 1.0% | ODTE | Broad underlying exposure is required, but allocation remains limited until the short-dated option process demonstrates consistent execution, sustainable distributions, and acceptable NAV and total-return behavior. |
| Speculative High-Reward Asymmetric Return Potential | Maintain tightly controlled exposure to exceptionally high-income strategies positioned to benefit from favorable semiconductor, memory, and artificial-intelligence investment cycles. | 2.5% | DRMY · CHPY | Elevated volatility, concentration, and limited operating history are permitted only when potential returns are unusually high. Position limits must prevent these strategies from threatening the portfolio's primary objectives. |
This reference allocation is intentionally retained as a documented implementation point rather than continuously rewritten to match market movement or every portfolio adjustment. Classifications and functional categories describe roles within the Design for Wealth™ framework rather than permanent endorsements of individual funds.
High-distribution ETFs can appear to lag broad-market benchmarks when evaluated using share-price movement alone because a meaningful portion of their economic return is distributed as cash. The comparison below examines the four Core Holdings and VOO over the same measurement period, first using share price return and then cumulative total return with distributions reinvested.
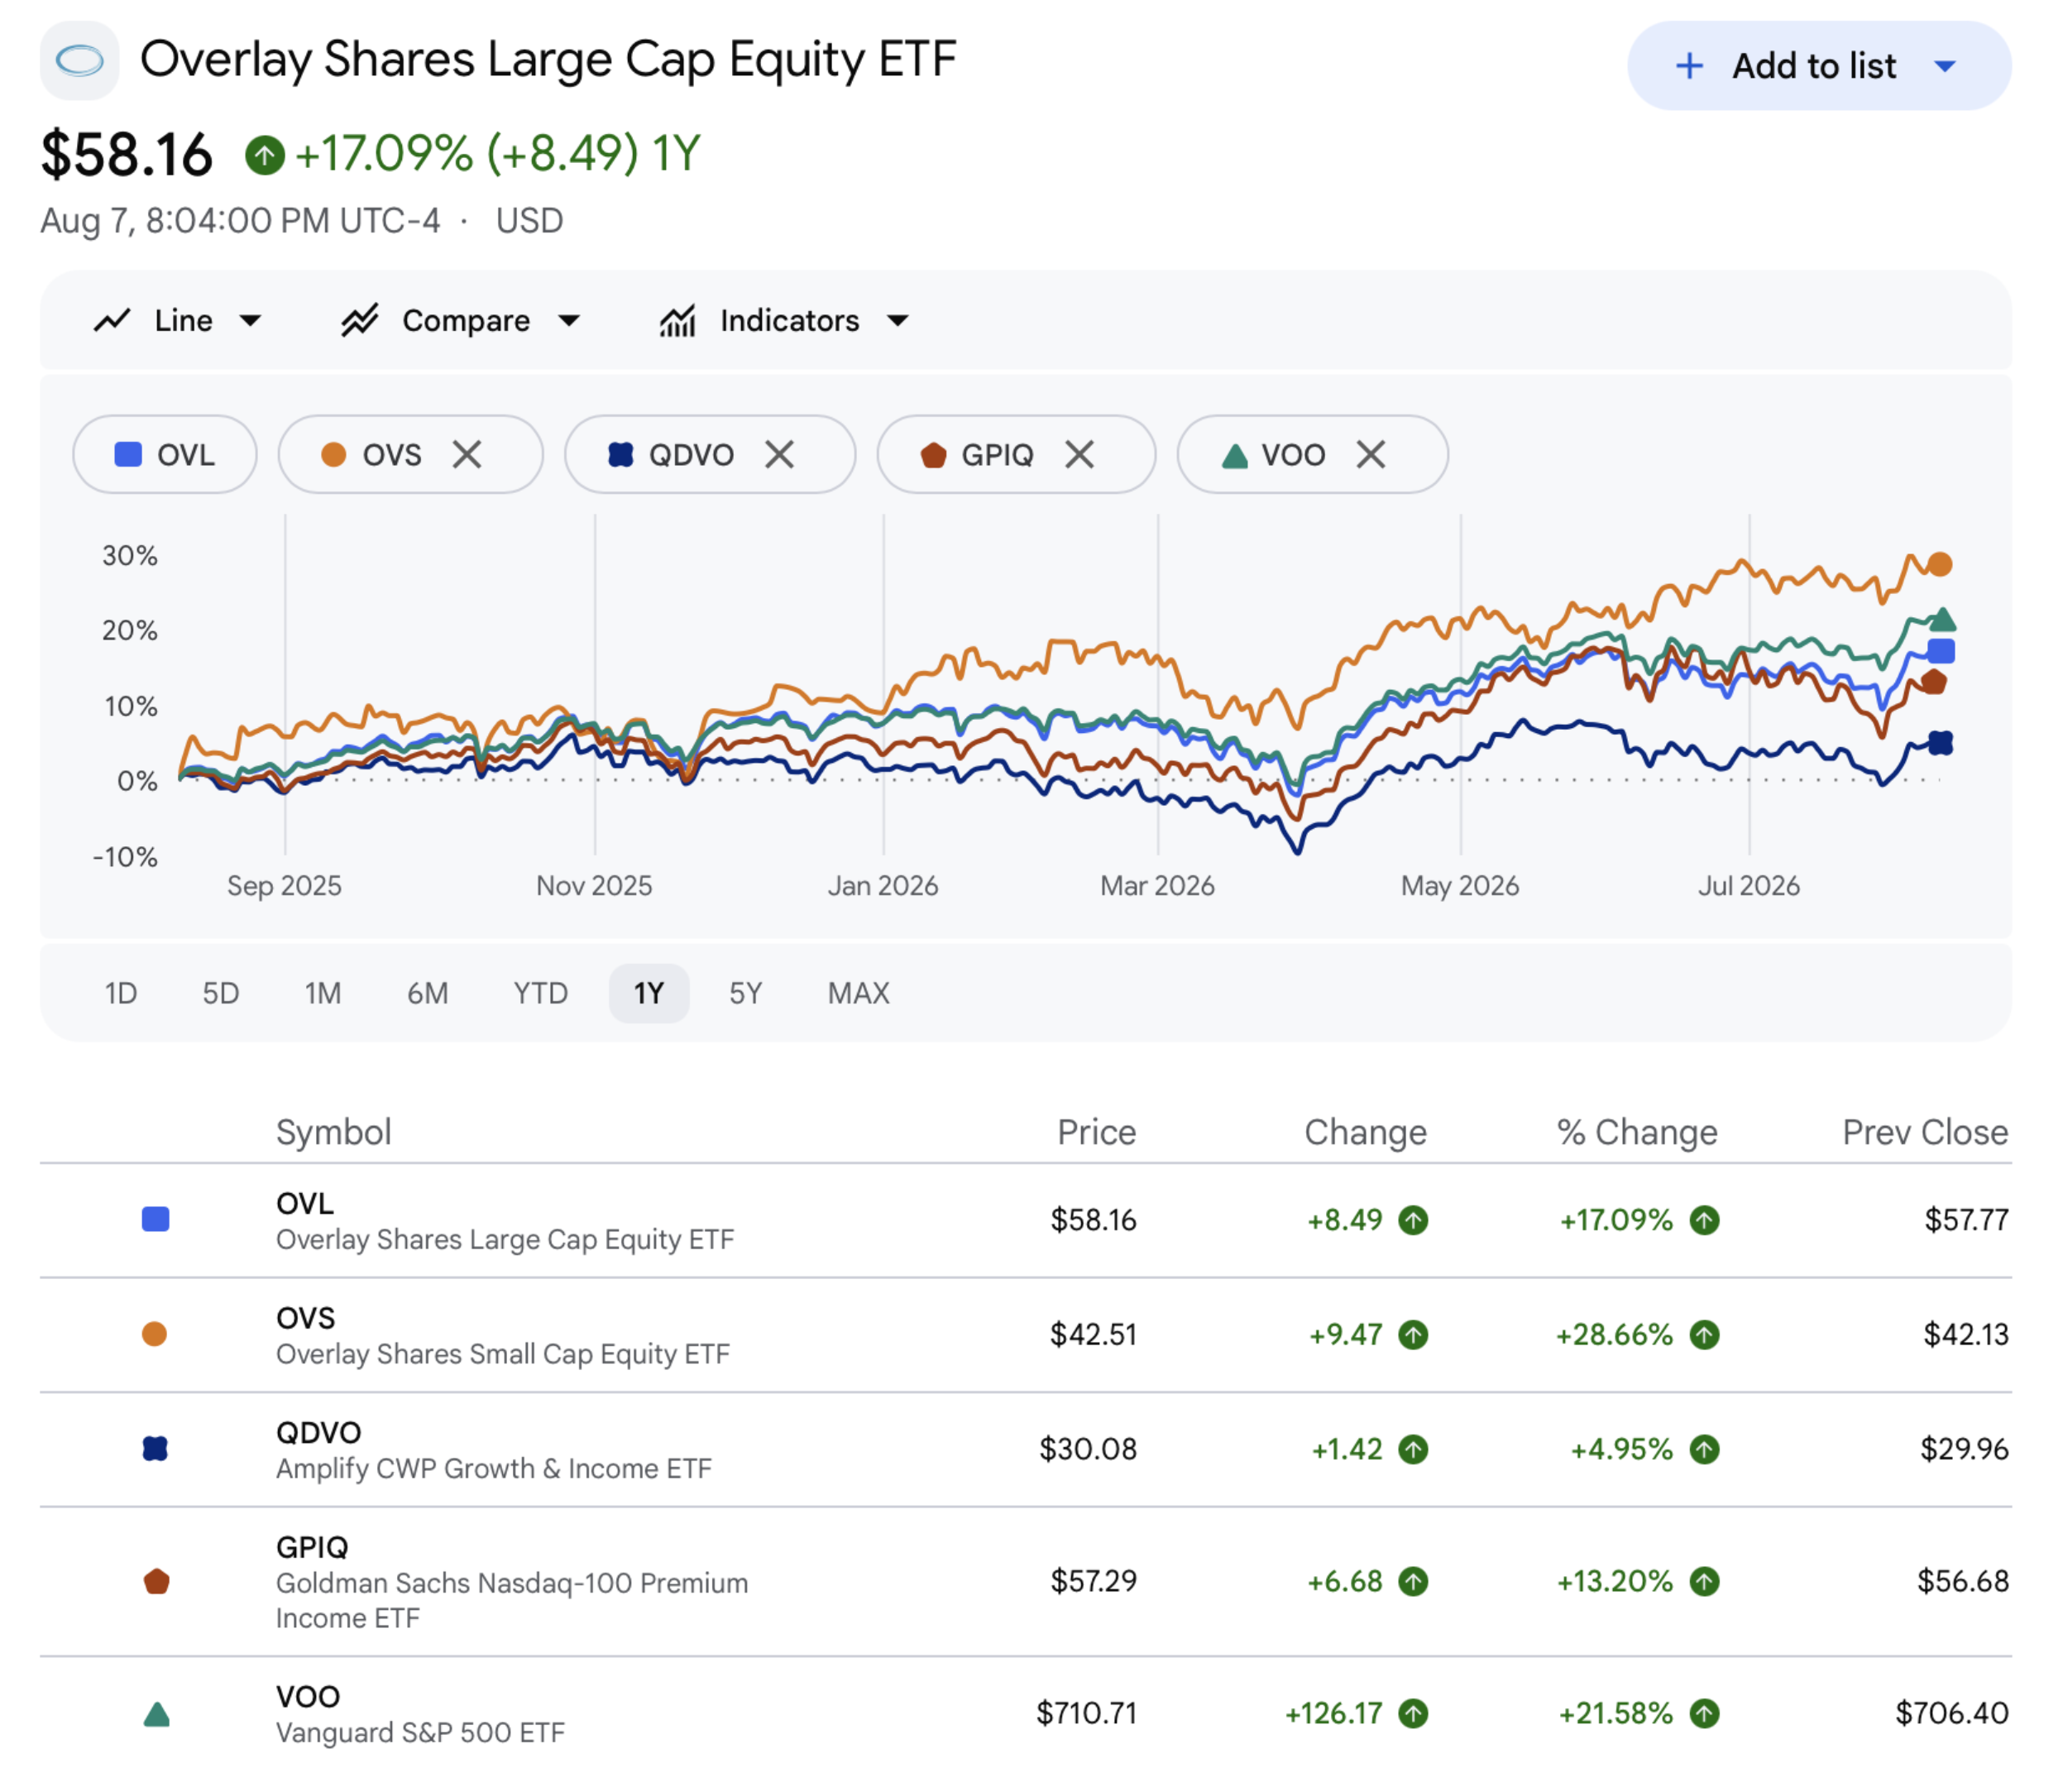
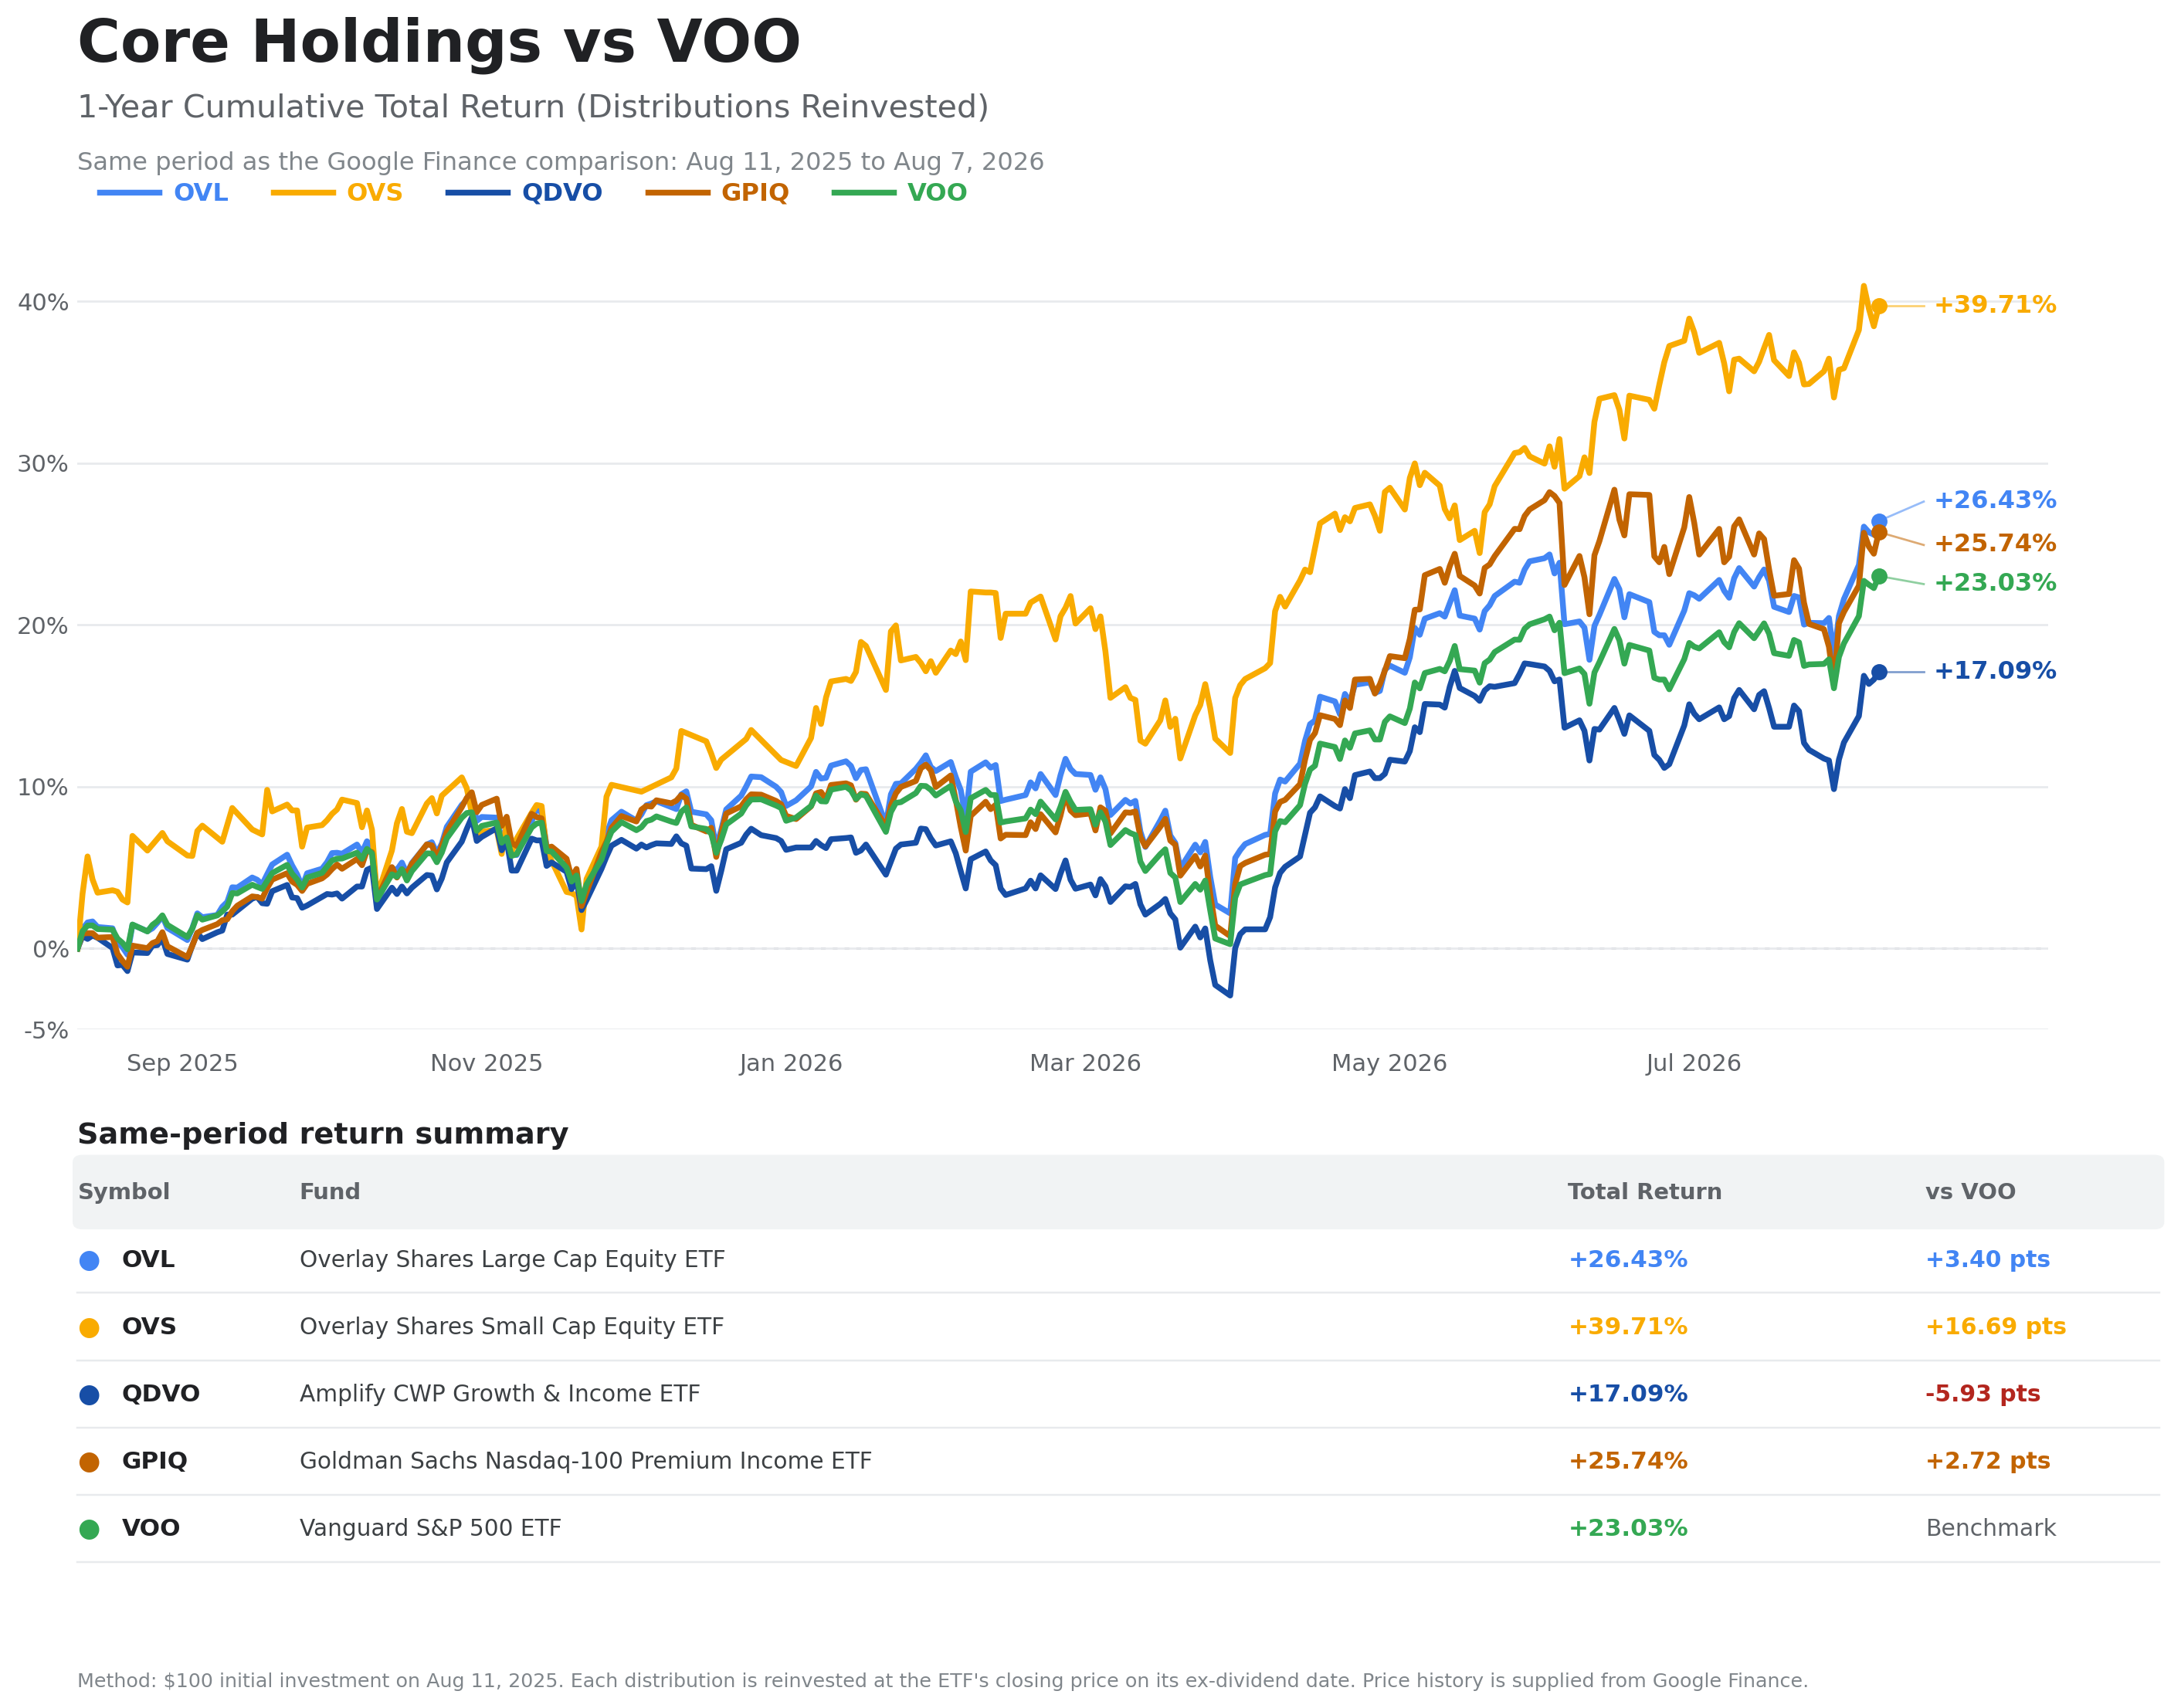
Individual Core Holdings are not required to outperform VOO independently. Each is selected to perform a defined portfolio role. At the Core allocation weights used in this comparison, the four holdings produced a 25.69% weighted cumulative total return versus 23.03% for VOO while providing substantially greater recurring cash distributions and differentiated large-cap, growth, technology, and small-cap exposure.
This comparison covers August 11, 2025 through August 7, 2026 and does not establish future outperformance. Total-return calculations begin with a $100 investment and reinvest each distribution during the measurement period. The weighted Core return applies the relative portfolio weights of the four Core Holdings, normalized within the Core group.
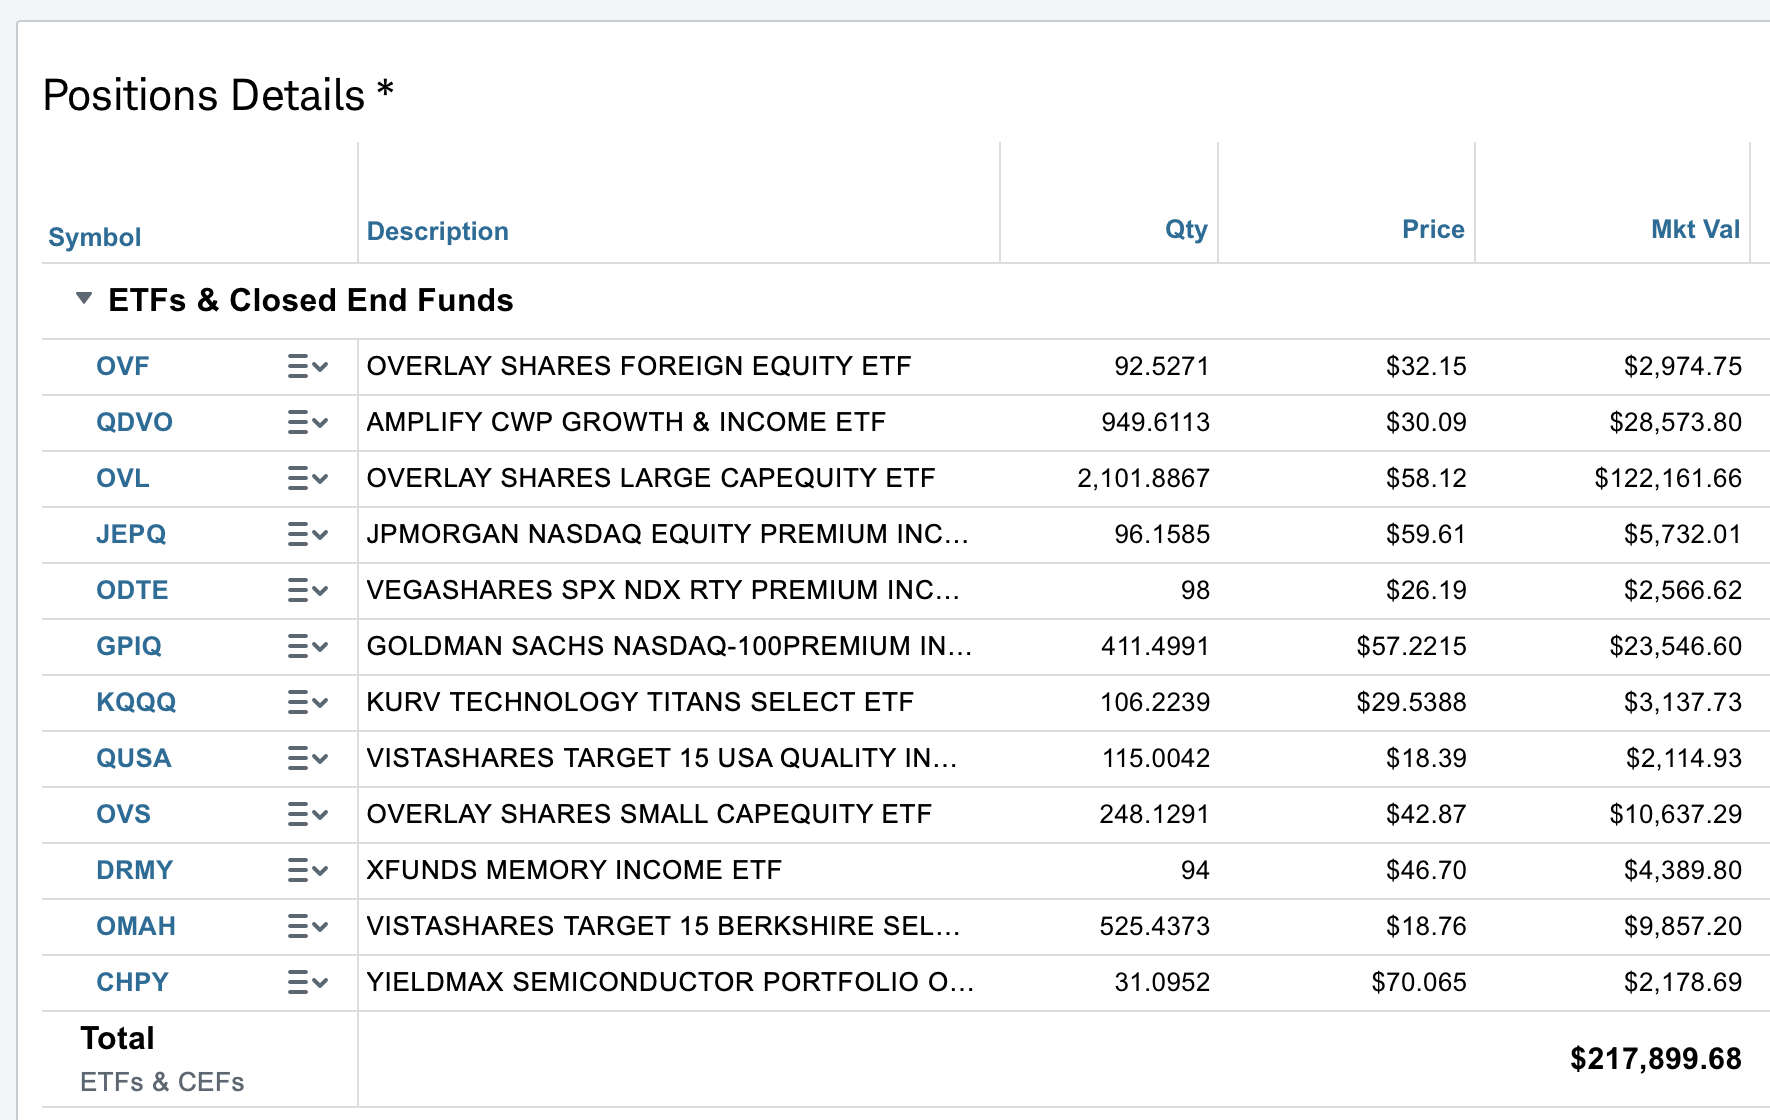
This case study documents a real supplemental taxable implementation of the Design for Wealth™ framework using real capital, actual positions, and documented July 2026 results. It should not be interpreted as a complete retirement or household investment strategy, proof of future performance, or a recommended allocation. Its purpose is to show how the portfolio architecture translates into cash distributions, reinvestment, and observed capital behavior. The holdings and allocations in this section are intentionally retained as a historical snapshot corresponding to the brokerage records and are not updated to match the live portfolio.
Brokerage account value shown in August 2026
Actual cash distributions received
July result multiplied by 12 for comparison
July income annualized using August 2026 portfolio value
July distributions divided by portfolio value
OVL, QDVO, GPIQ, and OVS at the documented snapshot
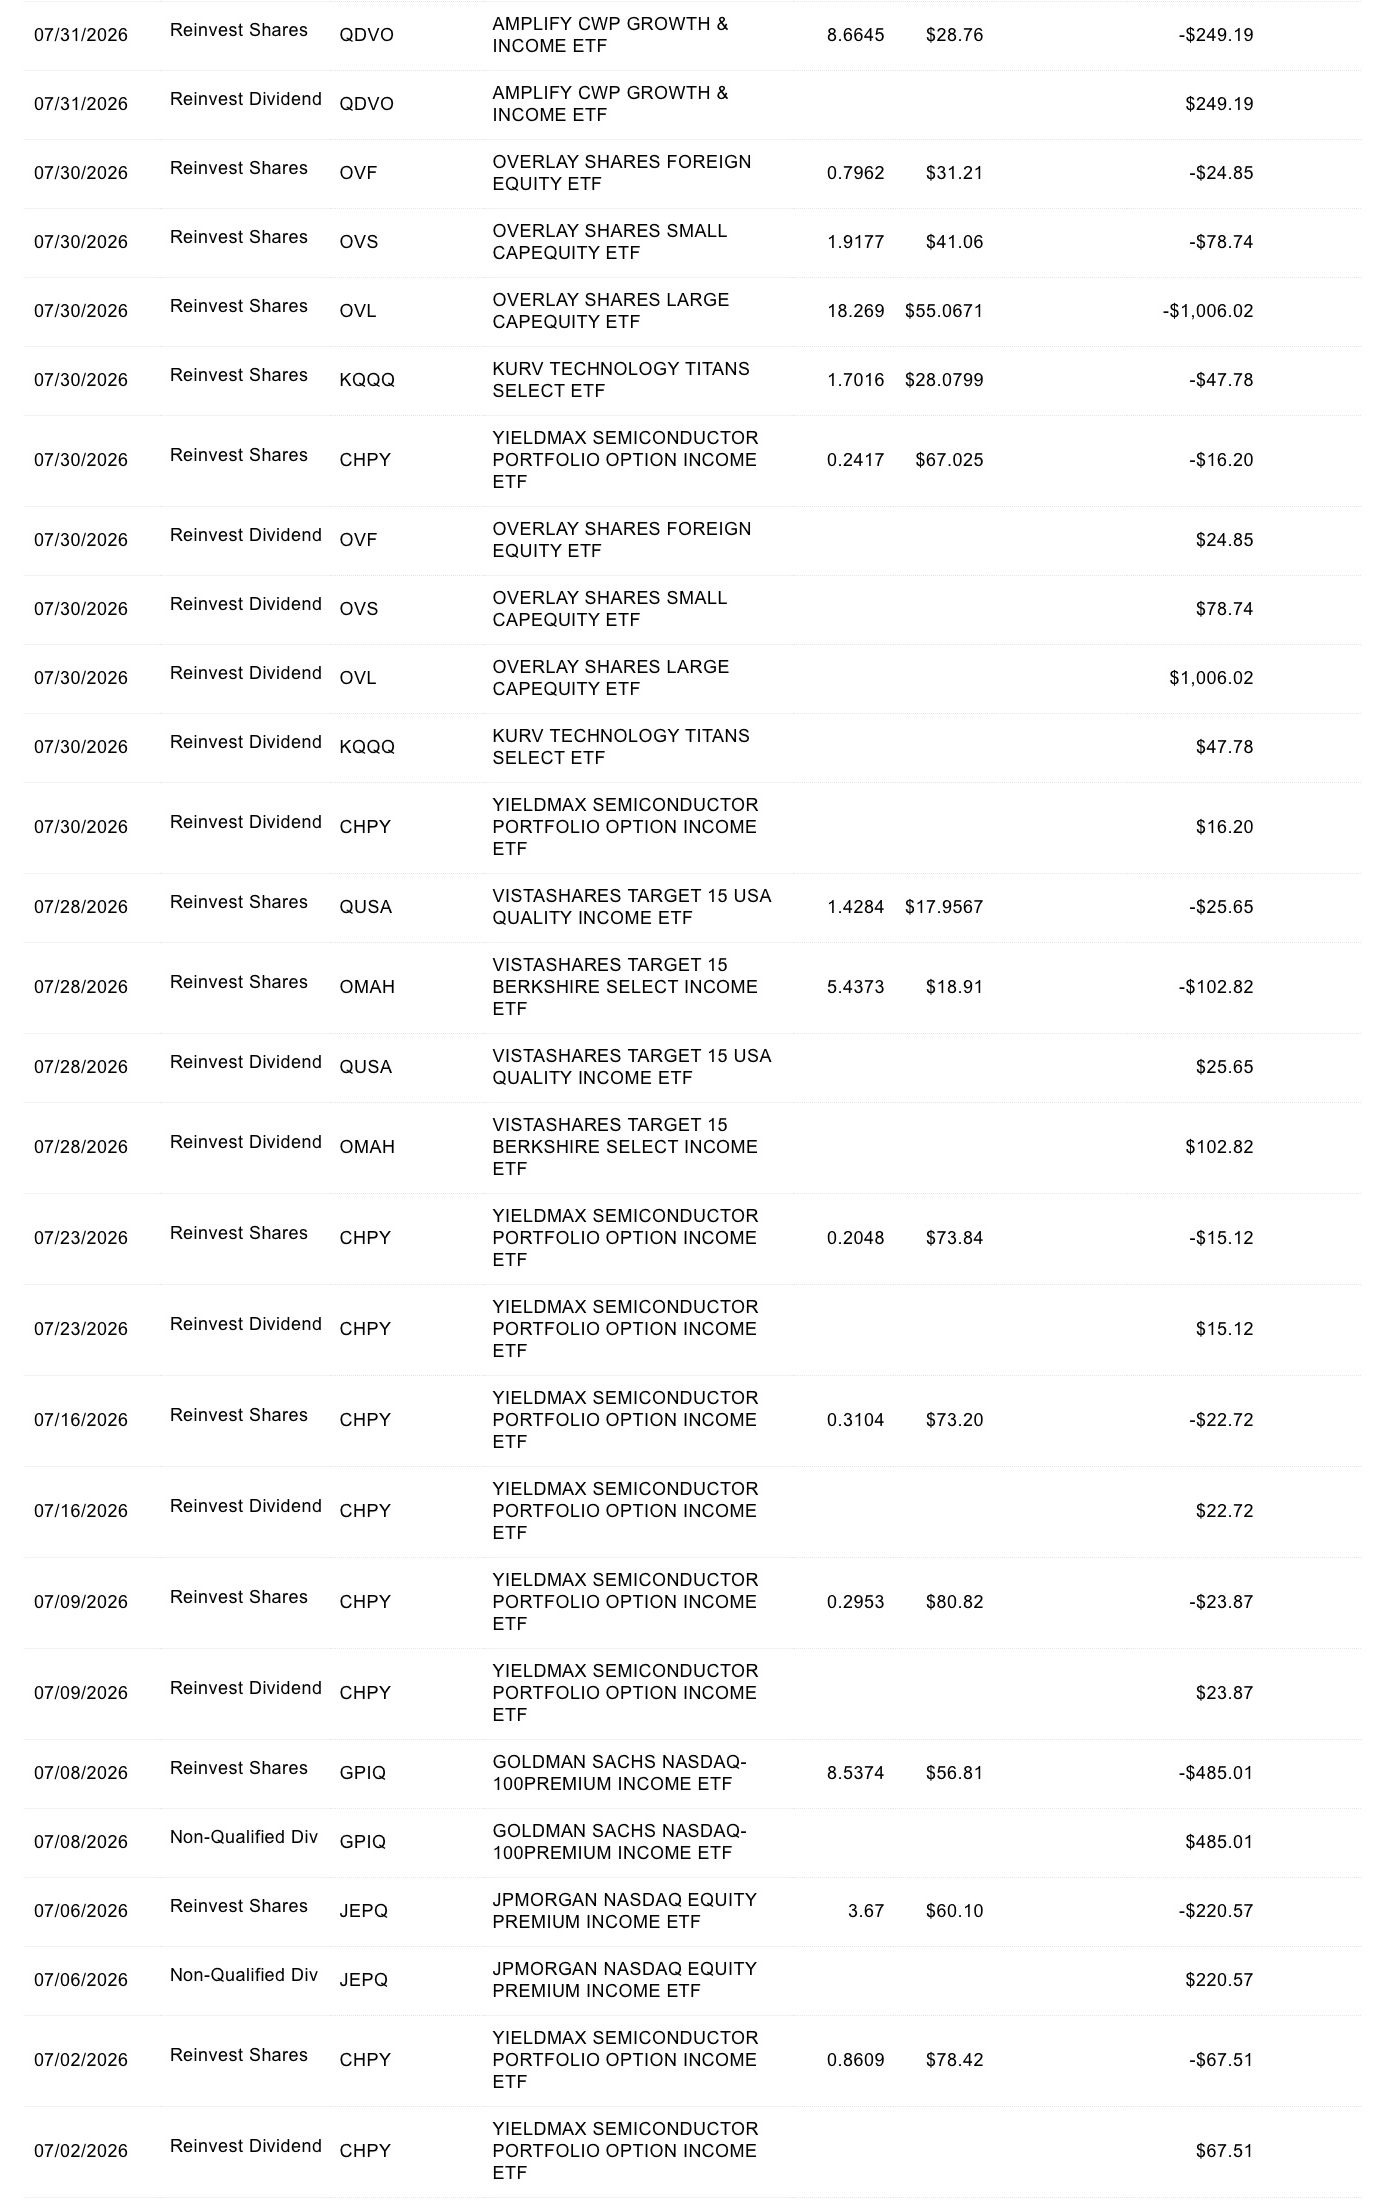
Actual cash distributions received during July 2026 from the portfolio holdings that made distributions during the month. Portfolio percentages are the documented allocations represented by the August 2026 brokerage holdings snapshot used in this case study.
| ETF | Portfolio Allocation at Case-Study Snapshot | Published Distribution Rate | July Cash Distribution |
|---|---|---|---|
| OVL | 56.0% | 10.52% | $1,006.02 |
| GPIQ | 11.0% | 9.70% | $485.01 |
| QDVO | 13.0% | 10.69% | $249.19 |
| JEPQ | 2.5% | 10.45% | $220.57 |
| CHPY | 1.0% | 40.96% | $145.42 |
| OMAH | 4.5% | 15.00% | $102.82 |
| OVS | 5.0% | 10.44% | $78.74 |
| KQQQ | 1.5% | 14.02% | $47.78 |
| QUSA | 1.0% | 15.00% | $25.65 |
| OVF | 1.5% | 8.80% | $24.85 |
| Total | $2,386.05 |
The distribution rows above represent 97.0% of the documented portfolio. The remaining positions in the historical holdings snapshot were ODTE (1.5%) and DRMY (1.5%). The table reports only the cash distributions included in the documented July brokerage activity; DRMY had not made its first distribution by the end of July 2026.
1 Recurring income without selling shares. The portfolio generated recurring cash distributions without requiring routine liquidation of ETF positions.
2 July income pace exceeded the design objective. The July distribution rate, when annualized for comparison, exceeded the portfolio's 10% annual cash-distribution objective.
3 Core allocation requirement satisfied. Core Holdings represented 85% of portfolio capital, exceeding the framework's minimum 80% allocation requirement.
4 DRIP reinvestment demonstrated. Distributions can be reinvested during accumulation to increase share count and future distribution capacity.
5 Multiple income methodologies represented. Portfolio income was produced through several ETF and option-overlay methodologies rather than dependence on a single implementation.
6 Potential tax efficiency. Certain option-income ETF distributions may receive tax treatment that defers recognition of some taxable income.
Certain option-income ETF distributions may receive tax-deferred return-of-capital treatment that reduces cost basis rather than creating immediate taxable income. ROC is evaluated together with NAV and cumulative-return behavior rather than treated as automatic evidence of economic deterioration.
The monthly income result should not be evaluated independently from the portfolio's capital trajectory. The principal Core Holdings generated substantial recurring distributions while maintaining an overall positive longer-term share-price or NAV slope during the measured period.
The observed combination is consistent with the framework's objective of generating high current income while minimizing opportunity cost in long-term cumulative wealth. The corresponding cumulative-return evidence is evaluated separately through the three performance models.
This case study reflects one brokerage account and one monthly distribution period. Portfolio value, ETF prices, NAV, published distribution rates, tax classifications, and cash payments will vary. The annualized figures convert the July result into an annual rate for comparison and do not forecast identical future monthly payments. Final tax treatment depends on fund reporting and the investor's individual circumstances. Long-term success is evaluated using cumulative total return, NAV behavior, distribution sustainability, and performance across multiple market environments. The case-study holdings and allocation percentages are historical evidence and intentionally remain fixed even when the live portfolio later changes.
Selected Charles Schwab account records document the actual portfolio implementation and cash distributions reported in this case study.
 VIEW FULL RESOLUTION
 VIEW FULL RESOLUTION
Brokerage records are presented as historical documentation of this case study. Portfolio holdings, market values, distributions, and reinvestment amounts change over time and do not represent expected future results.
Tax treatment can materially affect the value of current income in a taxable portfolio. Neither high-distribution ETFs nor periodic sales of passive investments such as VOO are inherently more tax-efficient. Selling high-basis shares can generate cash while realizing relatively little taxable gain, while distributions classified as return of capital can defer current taxes by reducing cost basis.
As of August 2026, most of the high-distribution ETFs used in the Design for Wealth™ case study report recent distributions that are predominantly or entirely estimated return of capital. ROC generally becomes taxable once cost basis reaches zero. With DRIP on, reinvested distributions continually create new cost basis, helping keep that from happening while allowing money that would otherwise have been paid in current taxes to remain invested and compound.
JEPQ illustrates why distribution tax character matters. J.P. Morgan states that its distributions are taxed primarily as qualified or ordinary income in the year received, while Goldman Sachs has historically classified the majority of GPIQ distributions as return of capital. In a taxable account, funds with similar headline distribution rates can therefore create meaningfully different current tax drag and after-tax compounding.
The relative advantage depends on cost basis, distribution tax character, tax rates, holding period, DRIP usage, and when assets are ultimately sold.
Distribution classifications shown in the detailed analysis are issuer estimates and may change. Final tax reporting is generally provided on Form 1099-DIV. This analysis is educational and is not individualized tax advice.
This assessment evaluates each issuer and management organization independently of the performance or merits of any single ETF. The question is whether the firm's organization-wide investment experience, institutional resources, management and operational depth, product-development record, scale, and demonstrated execution would support confidence in its ability to launch and operate investment strategies through changing market conditions.
Management teams and organizational information as of August 2026.
| Rank | Issuer and Relevant ETFs | Issuer / Management Confidence | Assessment of Management Credentials |
|---|---|---|---|
| 1 | Goldman Sachs Asset ManagementRelevant ETF: GPIQ | Very High | Goldman Sachs combines global institutional scale with deep quantitative-equity, derivatives, trading, research, risk, compliance, and operational capabilities. Senior portfolio leaders including Raj Garigipati, Aron Kershner, and John Sienkiewicz add directly relevant ETF and systematic-equity experience. The organization has the breadth, infrastructure, and management depth to support complex investment products without dependence on a single strategy or individual. |
| 2 | Amplify ETFsRelevant ETF: QDVO | Very High | Amplify has built a broad ETF platform with more than $20 billion in assets under management as of July 31, 2026. Founder and CEO Christian Magoon has launched more than 100 U.S. ETFs, while President William Belden brings more than 30 years of product-development and financial-services experience. The firm combines experienced ETF leadership, legal and compliance depth, national distribution, strategic investment partnerships, and a demonstrated ability to develop and scale actively managed and index-based strategies across income, growth, and risk-managed categories. |
| 3 | Liquid Strategies / Overlay SharesRelevant ETFs: OVL, OVS, OVF | Very High | Liquid Strategies has focused on options-based investing since its 2013 founding, with professional options-trading experience on the portfolio-management team dating to 1997. Shawn Gibson began as an options market maker and later helped oversee a multibillion-dollar options portfolio; Adam Stewart, CFA adds more than two decades of investment and trading experience. The firm has maintained core investment leadership since inception, expanded into a broader alternatives platform, and surpassed $2 billion in firmwide AUM in August 2026. Its smaller scale than the largest ETF sponsors is offset by unusually deep, continuous, and directly relevant derivatives experience plus meaningful investment, finance, operations, and compliance depth. |
| 4 | Simplify Asset ManagementRelevant ETF: SPUC | High | Simplify has rapidly built a multi-billion-dollar ETF platform focused on bringing institutional-style alternative, derivative, fixed-income, and risk-managed strategies into liquid ETF structures. David Berns, PhD, Shailesh Gupta, Jeff Schwarte, CFA, and a dedicated trading and risk-management organization provide substantial technical depth. The principal reason the rating remains below Very High is the platform's shorter organizational history relative to the three higher-ranked firms, not the merits or history of SPUC itself. |
| 5 | VistaShares / TidalRelevant ETFs: OMAH, QUSA | High | VistaShares combines experienced ETF entrepreneurship, investment research, company-building, and options expertise with Tidal's ETF operating infrastructure. Adam Patti previously founded and scaled IndexIQ before its acquisition by New York Life; the broader team includes experienced executives, academics, quantitative researchers, and options professionals. VistaShares surpassed $2 billion in AUM in July 2026, demonstrating unusually rapid platform adoption. The principal limitation is the issuer's comparatively short public operating history, not the performance of any individual VistaShares ETF. |
| 6 | VegaSharesRelevant ETF: ODTE | Moderate | Adam Stempel has more than two decades in finance and built multibillion-dollar structured-note and exchange-traded-note platforms, while Sunny Wong brings more than two decades in derivatives trading and senior structured-products experience. The professional backgrounds are highly relevant, but VegaShares remains a young ETF organization with less firmwide operating history, scale, and demonstrated platform breadth than the higher-ranked issuers. |
| 7 | YieldMax / TidalRelevant ETF: CHPY | Moderate | The YieldMax management organization combines substantial options-market experience with Tidal's established ETF operating platform. Jay Pestrichelli has more than 30 years in financial markets, and Scott Snyder brings more than 40 years of market experience including two decades as an independent CBOE options market maker. The organization has meaningful technical and operating capabilities, while the current management structure and platform record remain shorter than those of the higher-ranked firms. |
| 8 | Kurv Investment ManagementRelevant ETF: KQQQ | Moderate | Kurv's leadership brings genuine institutional experience. Howard Chan has more than 20 years in investment management including roles at Goldman Sachs and leadership of European ETFs at PIMCO, while Dominique Tersin brings extensive ETF and liquidity-management experience from PIMCO. The limiting factors are primarily organizational scale and the shorter public operating history of the Kurv platform compared with the larger and longer-established issuers above it. |
| 9 | XFUNDS / Nicholas Wealth / TidalRelevant ETF: DRMY | Developing | David Nicholas has more than 18 years in financial services, and Cory Reed, CFA adds experience managing concentrated and long-short equity strategies. Tidal contributes ETF trading, compliance, administration, and fund operations, while experienced options personnel add technical support. The organization remains the least proven in this comparison because Nicholas Wealth and XFUNDS have a smaller institutional footprint and shorter product-development and public ETF operating history. |
Issuer confidence is intentionally separate from ETF selection. A high ranking means the organization has the experience, resources, depth, and execution record to inspire greater confidence in its ability to design and operate investment products. It does not mean every ETF the organization launches should qualify for the Design for Wealth™ portfolio.
Individual funds must still earn inclusion through their own methodology, total-return and NAV evidence, distribution sustainability, three-model results, liquidity, operating history, and functional portfolio role. Likewise, a short or disappointing record for one ETF does not automatically reduce confidence in an otherwise strong issuer.
Rankings are comparative assessments based on publicly available professional backgrounds, organizational resources, stated management responsibilities, and relevant investment experience. They are analytical judgments, not credit ratings, guarantees of investment performance, or permanent conclusions. Rankings may change as management teams, organizational resources, assets under management, or operating histories evolve.
Design for Wealth™ supplements its quantitative analysis with direct conversations with ETF issuers and portfolio managers. In this interview, Liquid Strategies co-founder and CIO Shawn Gibson joins Design for Wealth™ editor Noah O'Brien to discuss the firm’s $2.1 billion in assets under management, investment process, risk controls, distribution policy, liquidity, and the rationale behind its put-spread overlay strategy.
Featured Guest
Co-Founder & Chief Investment Officer · Liquid Strategies
Design for Wealth™ addresses a recurring financial challenge: generating meaningful current income while maintaining long-term equity participation and controlling the opportunity cost of income-oriented strategies. These examples illustrate potential applications of the framework and are presented for educational purposes rather than individualized investment recommendations.
Objective: Generate meaningful monthly income during the period between leaving full-time employment and becoming eligible for penalty-free retirement-account withdrawals, pensions, or other retirement benefits.
Framework Application Portfolio distributions may help fund living expenses while reducing the need to sell long-term assets during an extended transition period.
Objective: Replace a portion of employment income with systematic portfolio distributions while maintaining participation in long-term capital appreciation.
Framework Application Recurring investment income may make reduced work schedules, consulting, seasonal employment, or lower-stress careers financially practical.
Objective: Provide an additional stream of recurring income that complements Social Security, pensions, annuities, and retirement-account withdrawals while seeking to preserve long-term purchasing power.
Framework Application Portfolio income may reduce dependence on any single retirement-income source while providing additional flexibility for discretionary spending.
Objective: Create a dedicated investment portfolio that helps fund recurring business expenses such as software, telecommunications, insurance, professional services, utilities, website hosting, and administrative overhead.
Framework Application Monthly portfolio distributions may help fund recurring business expenses and, for a lean or home-based business, may cover the full cost of routine operating overhead without relying on current client revenue.
Objective: Produce recurring income to support charitable programs and operating expenses while seeking to preserve the long-term value of donated capital.
Framework Application Income-producing investments may supplement fundraising revenue within the organization's approved investment and spending policies while allowing the underlying capital base to remain invested for future generations.
Objective: Use recurring portfolio income to support living expenses in a lower-cost foreign location.
Framework Application Lower living costs can allow the same portfolio distributions to cover a larger share of expenses, reducing the capital required for financial independence.
Objective: Maintain a diversified income-producing portfolio whose distributions can be reinvested during normal periods and redirected to cash when major household expenses, unexpected life events, career transitions, health-related disruptions, or other financial needs arise.
Framework Application Temporarily turning off DRIP can redirect recurring portfolio distributions into a meaningful cash reserve for major expenses without requiring the immediate sale of invested assets or the realization of losses during an unfavorable market.
Objective: Generate recurring portfolio income that can help fund preschool through Grade 12 private-school tuition and related education expenses while keeping long-term investment capital substantially invested.
Framework Application Recurring portfolio distributions can be accumulated for scheduled tuition payments, reducing the need to sell stocks or ETFs when markets may be temporarily depressed and helping limit forced-sale risk.
Objective: Build a portfolio capable of generating sufficient recurring income to support living expenses while maintaining long-term participation in equity-market growth.
Framework Application A high-income portfolio may reduce reliance on predetermined withdrawal schedules while providing flexibility during periods of market volatility.
These use cases are educational examples only. They do not constitute personalized investment, tax, retirement, legal, immigration, education, or financial planning advice.
Long-horizon portfolio design requires explicit assumptions about markets, investment instruments, taxation, model interpretation, and how investment evidence is applied in practice. These items make those assumptions and design principles visible so they can be evaluated and revised rather than remaining implicit within the framework.
| No. | Assumption or Note | Framework Treatment |
|---|---|---|
| 01 |
Long-Term Market Direction |
High-Probability Assumption
A high probability is assigned to diversified U.S. equities producing a positive cumulative total return over a 20-year investment horizon, despite the likelihood of significant interim declines, recessions, and periods of weak or negative performance. Extended stagnation or negative long-term returns have occurred in other major markets, including Japan, demonstrating that this outcome is not guaranteed. |
| 02 |
Continued Relevance of Capital Markets |
High-Probability Assumption
A high probability is assigned to stocks, ETFs, and listed options remaining materially relevant mechanisms for capital ownership and investment income over the next 20 years. Major technological or economic shifts, including artificial intelligence, humanoid robotics, or sustained-abundance scenarios, could materially alter how capital ownership and investment income function. |
| 03 |
Option-Market Capacity and Strategy Crowding |
High-Probability Assumption
A high probability is assigned to U.S. listed options markets retaining sufficient depth and adaptability over the next 20 years to support option-based portfolio strategies. The future economics of particular option-income strategies are less certain. Increased adoption could cause multiple funds to sell similar options or spreads on the same underlying assets, increasing supply at particular strikes and expirations and potentially compressing option premiums. Market depth, evolving volatility regimes, changing market structure, and continued product innovation are expected to limit, but not eliminate, crowding risk. |
| 04 |
Tax-Efficient Distribution Design |
High-Probability Assumption
A high probability is assigned to option-income ETF issuers continuing to consider tax efficiency when structuring portfolio and distribution mechanics where economically and legally available. ETF distributions may receive different tax classifications, including ordinary dividends, qualified dividends, capital-gain distributions, and nondividend distributions such as return of capital. Option transactions can also affect the tax character of fund income. These differences can materially affect after-tax cash flow, making tax treatment an intentional consideration in taxable-account portfolio design rather than an incidental feature of the distribution. |
| 05 |
Benchmark Discipline and Market Humility |
Design Philosophy Note
Design for Wealth™ does not assume that persistent market outperformance can be reliably identified in advance or sustained over an investor's lifetime. The S&P 500 therefore serves as the primary universal opportunity-cost benchmark rather than a return target the portfolio is expected to exceed. Exposure-specific passive benchmarks are also used to determine whether a strategy adds value relative to the market exposure it is designed to provide. Sector, thematic, and manager-driven strategies may outperform for extended periods, but the framework does not depend on forecasts that technology or any other market segment will continue to lead indefinitely. The design objective is to generate high recurring income while keeping long-term cumulative return competitive with broad U.S. equities.
This principle also reflects Charlie Munger's enduring emphasis on
intellectual humility:
markets have a way of humbling even exceptionally intelligent and
accomplished investors.
|
| 06 |
Controlled Exposure to Technology Adoption S-Curves |
Design Philosophy Note
The framework permits a deliberately limited allocation to emerging opportunities when observable evidence indicates that a technology, industry, or economic development may be progressing through a significant adoption S-curve. As of August 2026, the current implementation reserves approximately 4% of portfolio capital for Experimental Holdings, allowing participation in structural developments without requiring the portfolio's long-term success to depend on a thematic forecast. Relevant evidence may include accelerating adoption, capital investment, supply constraints, industry activity, changing customer behavior, or firsthand professional and consumer observations. Because even correctly identified technology S-curves may already be reflected in market prices, or may fail to produce superior investment returns, exposure remains intentionally constrained. |
| 07 |
Applied Framework and Iterative Validation |
Framework Development Note
Design for Wealth™ is an applied portfolio-design framework developed through actual capital deployment, comparative observation, modeling, and iterative refinement rather than as a purely conceptual investment exercise. The principles and classification rules were developed through repeated observation of ETF behavior across differing market conditions, including sharp single-day declines, strong market advances, multi-day corrections, and changing volatility environments. Differences in downside participation, recovery behavior, NAV trajectory, option-income generation, and relative performance were used alongside quantitative modeling to refine portfolio roles and allocation rules. The resulting framework therefore reflects both modeled evidence and observed implementation experience. Short-term implementation observations are treated as additional evidence rather than substitutes for the longer-horizon three-model analysis. |
| 08 |
ROC Interpretation in AI Audits |
Model-Audit Note
AI-generated investment analysis has historically incorrectly treated return of capital (ROC) as automatic NAV destruction. Anyone using AI to audit the Design for Wealth™ framework should require ROC to be evaluated using NAV trajectory, cumulative total return, option-premium economics, and distribution coverage. OVL can be provided as a useful counterexample because it has reported high ROC classifications while preserving and growing NAV. |
| 09 |
Three-Model Interpretation and Uncertainty |
Model Interpretation Note
The three models are complementary analytical perspectives rather than independent forecasts of the future. Model 1 measures actual observed results, Model 2 reconstructs strategy behavior through a longer historical environment, and Model 3 examines plausible future structural regimes and uncertainty. Shared evidence may influence more than one model, and no ranking establishes a known future outcome. Greater weight is placed on conclusions that remain credible across different analytical perspectives. |
| 10 |
Fund Continuity and Strategy Change |
Implementation Note
Portfolio roles are expected to be more durable than individual ETFs. Funds may close, merge, change managers, modify investment methodology, alter option coverage, change fees, or experience deterioration in execution quality. A holding remains in the design only while its current structure and evidence continue to satisfy the requirements of its assigned role. |
| 11 |
Assumptions Remain Revisable |
Continuous Improvement
These assumptions are working design inputs rather than permanent conclusions. The framework should be revised when credible new evidence materially changes their probability, relevance, or effect on the portfolio design. |
Probability descriptions are qualitative design judgments used to make the framework's foundational assumptions explicit. They are not statistical forecasts or estimates of a specific numerical probability.
Plain-language definitions of investment and modeling terms used throughout Design for Wealth™.
“Zero Days to Expiration.” An option that expires on the same trading day, allowing strategies to repeatedly generate short-duration option exposure and premium.
Assets Under Management. The total value of investor assets held in a fund.
An investment or market index used as a reference for judging another investment's performance.
Compound Annual Growth Rate. The single annual growth rate that would turn a starting value into its ending value over a specified period.
A contract giving its buyer the right to purchase an investment at a predetermined price. The seller receives cash for accepting the obligation to sell at that price if exercised.
An income strategy in which an investor owns shares and receives cash for giving someone else the right to buy those shares at a predetermined price. Strong price gains may therefore be partially surrendered.
The total percentage gain or loss over a period after including both changes in investment value and distributions.
Cash paid by a fund to shareholders. It may come from dividends, interest, option income, capital gains, return of capital, or a combination of sources.
An annualized measure of a fund's current cash distributions relative to its share value. Calculation methods vary by issuer, and distribution rate is not the same as investment return.
Dividend Reinvestment Plan. Cash distributions are automatically used to purchase additional shares rather than being taken as cash.
A structured security whose return is linked to an equity index or investment strategy. Some income ETFs use ELNs to obtain option-like exposure and generate distributions.
Exchange-Traded Fund. A fund whose shares trade on an exchange like a stock and which owns investments or follows a defined investment strategy.
A qualitative assessment of how strongly the available history, benchmark fit, strategy evidence, and other inputs support an analytical conclusion. It does not measure the probability that a forecast will be correct.
The annual operating cost of a fund expressed as a percentage of its assets. Fund expenses reduce investor returns.
The estimated annualized return produced by a model after combining the assumed market exposure return, estimated strategy effect, and fund expenses.
A simulation that tests how consistently an ETF ranks across many plausible future market paths and assumptions rather than relying on one projected outcome.
A computer model that runs many different possible future market paths to estimate a range of outcomes rather than assuming one knowable future.
Net Asset Value. The per-share value of what a fund owns after subtracting what it owes.
A financial contract giving one party specific rights to buy or sell an investment at an agreed price while creating a corresponding obligation for the seller.
An options strategy added to an underlying investment portfolio to alter its income, risk, or return characteristics.
The cash an option buyer pays to an option seller for the rights created by the contract.
The return gained or surrendered by choosing one investment instead of an appropriate alternative. Design for Wealth™ uses opportunity-cost comparisons to evaluate whether income generation justifies any reduction in cumulative return.
A unit used to express the arithmetic difference between two percentages. Moving from 10% to 12% is +2 pp; moving from 12% to 10% is −2 pp.
A contract giving its buyer the right to sell an investment at a predetermined price. The seller receives cash for accepting the obligation to buy at that price if exercised.
A strategy combining put options at different predetermined prices to create a defined income or risk profile.
A tax classification in which part of a distribution is generally treated as a return of invested capital rather than current taxable income, often reducing cost basis and potentially deferring tax until the investment is sold. ROC does not automatically indicate economic loss or NAV destruction.
The percentage change in an investment's market price over a period, excluding cash distributions.
The estimated return added or subtracted by an ETF's investment and income methodology relative to its reference exposure. For actively managed funds, it may include both security selection and option implementation.
A coherent set of economic and market assumptions used to test how investments may perform under a particular future environment. A scenario is an analytical case, not a prediction that the future will unfold that way.
Investment performance after including both changes in value and cash distributions.
The investment, group of investments, or market index on which a fund or options strategy is based.
The degree to which prices or returns fluctuate. Higher volatility generally means a wider range of possible gains and losses.
Portfolio Engineering
Noah O'Brien
Creator, Design for Wealth™

He holds a Master of Science in Engineering with a concentration in Industrial and Lean Systems, including application of Six Sigma, statistical analysis, and Monte Carlo simulation, as well as a Master of Business Administration (MBA) with a focus in corporate finance, accounting, and investment analysis.
His professional career began in field of reliability engineering and progressed into the design and implementation of World Class Manufacturing and Design for X systems for large international manufacturing organizations. His work has centered on analyzing complex systems, identifying sources of loss, evaluating trade-offs, improving reliability and performance, and developing structured methods for evidence-based design and continuous improvement.
Design for Wealth™ applies those same engineering and financial-analysis principles to portfolio design through objective definition, trade-off analysis, three-model validation, evidence-based allocation, and continuous improvement.